Estimated Value: $334,000 - $355,000
About This Home
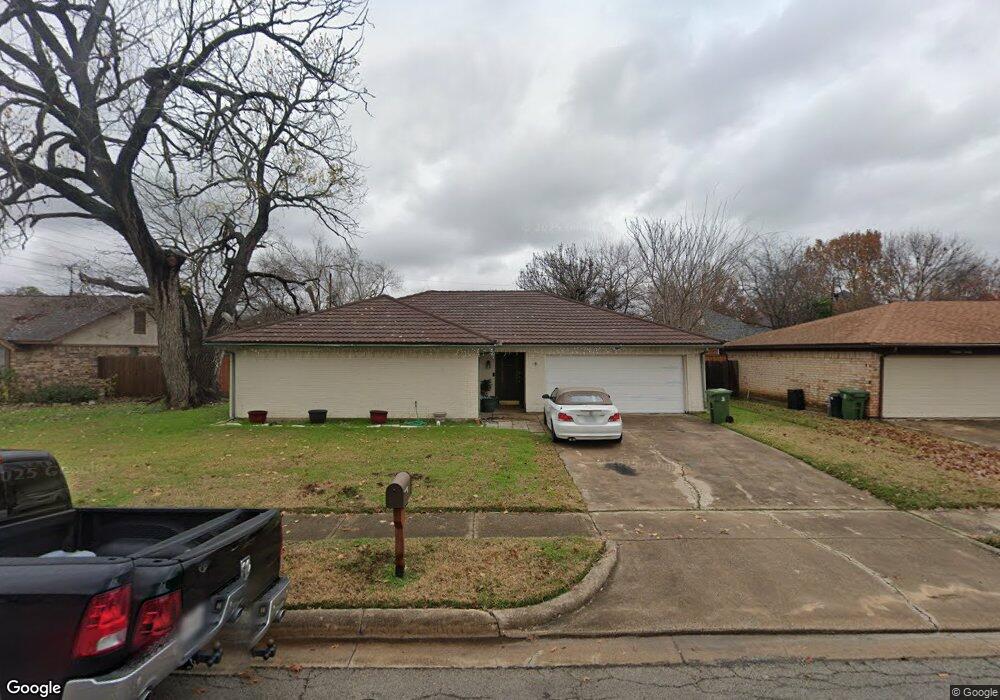
This home is located at 1924 Hurstview Dr, Hurst, TX 76054 and is currently estimated at $344,533, approximately $223 per square foot. 1924 Hurstview Dr is a home located in Tarrant County with nearby schools including Shady Oaks Elementary School, Bedford Junior High School, and L.D. Bell High School.
Ownership History
We collect this data history from publicly available records. To have your information removed, we recommend requesting removal directly through your county’s website.
Purchase Details
Home Financials for this Owner
Home Financials are based on the most recent Mortgage that was taken out on this home.Purchase Details
Home Financials for this Owner
Home Financials are based on the most recent Mortgage that was taken out on this home.Purchase Details
Home Values in the Area
Average Home Value in this Area
Purchase History
We collect this data history from publicly available records. To have your information removed, we recommend requesting removal directly through your county’s website.
| Date | Buyer | Sale Price | Title Company |
|---|---|---|---|
| -- | None Available | ||
| -- | -- | ||
| -- | -- | ||
| $62,819 | -- |
Mortgage History
We collect this data history from publicly available records. To have your information removed, we recommend requesting removal directly through your county’s website.
| Date | Status | Borrower | Loan Amount |
|---|---|---|---|
| Open | $217,280 | ||
| Previous Owner | $85,750 |
Tax History
We collect this data history from publicly available records. To have your information removed, we recommend requesting removal directly through your county’s website.
| Year | Tax Paid | Tax Assessment Tax Assessment Total Assessment is a certain percentage of the fair market value that is determined by local assessors to be the total taxable value of land and additions on the property. | Land | Improvement |
|---|---|---|---|---|
| 2025 | $4,181 | $297,055 | $65,000 | $232,055 |
| 2024 | $4,016 | $297,055 | $65,000 | $232,055 |
| 2023 | $4,961 | $303,376 | $45,000 | $258,376 |
| 2022 | $5,183 | $244,383 | $45,000 | $199,383 |
| 2021 | $4,935 | $204,630 | $45,000 | $159,630 |
| 2020 | $4,650 | $214,003 | $45,000 | $169,003 |
| 2019 | $4,300 | $215,436 | $45,000 | $170,436 |
| 2018 | $3,342 | $159,720 | $45,000 | $114,720 |
| 2017 | $3,674 | $179,123 | $35,000 | $144,123 |
| 2016 | $3,340 | $154,674 | $35,000 | $119,674 |
| 2015 | $2,726 | $120,000 | $15,000 | $105,000 |
| 2014 | $2,726 | $120,000 | $15,000 | $105,000 |
Map
- 461 Shade Tree Ct
- 421 Cavender Ct
- 1917 Mesquite Trail
- 330 W Harwood Rd Unit D
- 333 Mountainview Dr
- 322 W Harwood Rd Unit B
- 329 Stratford Dr
- 2121 Mountainview Dr
- 620 Highview Ln
- 520 Baker Dr
- 440 W Louella Dr
- 604 Baker Dr
- 617 Indian Trail
- 305 Chantilly Ct
- 600 Circleview Dr N
- 612 Circleview Dr S
- 2221 Farrington Ln
- 2228 Mountainview Dr
- 2241 Mountainview Dr
- 1620 Oak Creek Dr
- 464 Shade Tree Cir
- 468 Shade Tree Cir
- 460 Shade Tree Cir
- 1920 Hurstview Dr
- 1916 Hurstview Dr
- 470 Shade Tree Cir
- 458 Shade Tree Cir
- 441 Shade Tree Cir
- 437 Shade Tree Cir
- 1912 Hurstview Dr
- 1928 Hurstview Dr
- 472 Shade Tree Cir
- 445 Shade Tree Cir
- 433 Shade Tree Cir
- 1908 Hurstview Dr
- 474 Shade Tree Cir
- 454 Shade Tree Cir
- 1932 Hurstview Dr
- 478 Shade Tree Cir
- 449 Shade Tree Cir
Ask me questions while you tour the home.