J
Landlord's Agent in 2023
Jaimie Schmidt
RED BARN REALTY
Estimated Value: $353,000 - $373,000
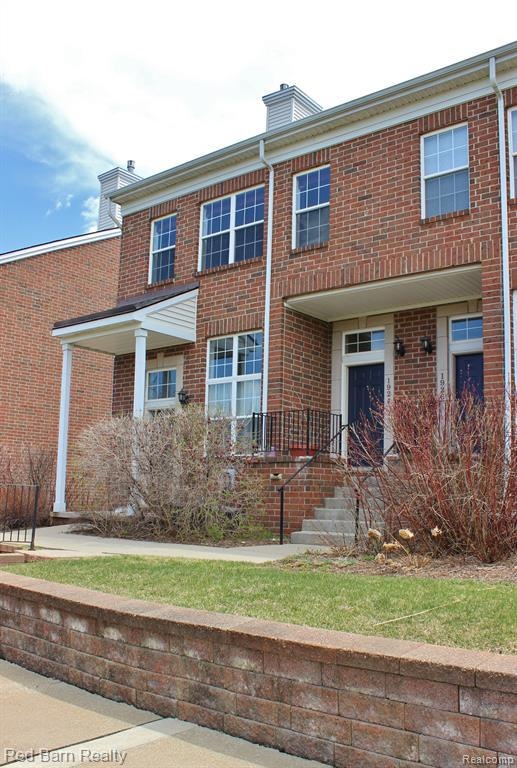
Amazing Location for easy access to U of M's campus and the local Hospitals! On several bus routes, you can explore Ann Arbor and get to work but still have the walkability of nearby green spaces, local shopping, and dining. Inside, the vaulted ceiling in the open floor plan leads you to the spectacularly updated kitchen. The balcony allows light to fill the main level including a bedroom/office space near the full bath on the lower level. The private 2nd-floor main bedroom has an en-suite bath and a large walk-in closet with built-in organizers. One car garage with storage below.
Last Agent to Rent the Property
Jaimie Schmidt
RED BARN REALTY License #6501374060 Listed on: 01/25/2023
Last Renter's Agent
Jaimie Schmidt
RED BARN REALTY License #6501374060 Listed on: 01/25/2023
| Date | Buyer | Sale Price | Title Company |
|---|---|---|---|
| Bolon Kevin M | $208,888 | None Available |
| Date | Event | Price | List to Sale | Price per Sq Ft |
|---|---|---|---|---|
| 03/25/2023 03/25/23 | Rented | $2,400 | 0.0% | -- |
| 03/20/2023 03/20/23 | Under Contract | -- | -- | -- |
| 01/25/2023 01/25/23 | For Rent | $2,400 | +20.0% | -- |
| 01/28/2020 01/28/20 | Rented | $2,000 | +2.6% | -- |
| 01/28/2020 01/28/20 | Under Contract | -- | -- | -- |
| 08/23/2019 08/23/19 | For Rent | $1,950 | 0.0% | -- |
| 02/02/2019 02/02/19 | Rented | $1,950 | 0.0% | -- |
| 02/02/2019 02/02/19 | Under Contract | -- | -- | -- |
| 01/21/2019 01/21/19 | For Rent | $1,950 | +2.6% | -- |
| 12/08/2016 12/08/16 | Rented | $1,900 | -2.6% | -- |
| 12/07/2016 12/07/16 | Under Contract | -- | -- | -- |
| 09/10/2016 09/10/16 | For Rent | $1,950 | +2.6% | -- |
| 06/02/2014 06/02/14 | Rented | $1,900 | -2.6% | -- |
| 05/20/2014 05/20/14 | Under Contract | -- | -- | -- |
| 05/09/2014 05/09/14 | For Rent | $1,950 | -- | -- |
| Year | Tax Paid | Tax Assessment Tax Assessment Total Assessment is a certain percentage of the fair market value that is determined by local assessors to be the total taxable value of land and additions on the property. | Land | Improvement |
|---|---|---|---|---|
| 2025 | $6,081 | $168,800 | $0 | $0 |
| 2024 | $5,109 | $162,100 | $0 | $0 |
| 2023 | $6,081 | $156,100 | $0 | $0 |
| 2022 | $4,411 | $143,900 | $0 | $0 |
| 2021 | $7,951 | $147,200 | $0 | $0 |
| 2020 | $5,374 | $132,700 | $0 | $0 |
| 2019 | $5,126 | $110,300 | $110,300 | $0 |
| 2018 | $5,029 | $106,200 | $0 | $0 |
| 2017 | $4,852 | $101,500 | $0 | $0 |
| 2016 | $4,207 | $76,407 | $0 | $0 |
| 2015 | $3,511 | $76,179 | $0 | $0 |
| 2014 | $3,511 | $73,800 | $0 | $0 |
| 2013 | -- | $73,800 | $0 | $0 |
J
Landlord's Agent in 2023
Jaimie Schmidt
RED BARN REALTY
N
Buyer's Agent in 2020
No Member
Non Member Sales

Seller's Agent in 2019
James McCarthy
Real Estate One Inc
(734) 864-2442
31 Total Sales
Source: Realcomp
MLS Number: 20230005923
APN: 09-35-306-035
Disclaimer: Certain information contained herein is derived from information provided by parties other than Homes.com. All information provided is deemed reliable, but is not guaranteed to be accurate and should be independently verified.
![]() IDX provided courtesy of Realcomp II Ltd. via Ten-X and MLS
IDX provided courtesy of Realcomp II Ltd. via Ten-X and MLS
Copyright 2025 Realcomp II Ltd. Shareholders
IDX information is provided exclusively for consumers' personal, noncommercial use and may not be used for any purpose other than to identify prospective properties consumers may be interested in purchasing. The accuracy of all information, regardless of source, is not guaranteed or warranted. All information should be independently verified.
Listing Information presented by local MLS brokerage: Ten-X, local REALTOR®- Arlene Richardson - (888)-952-6393