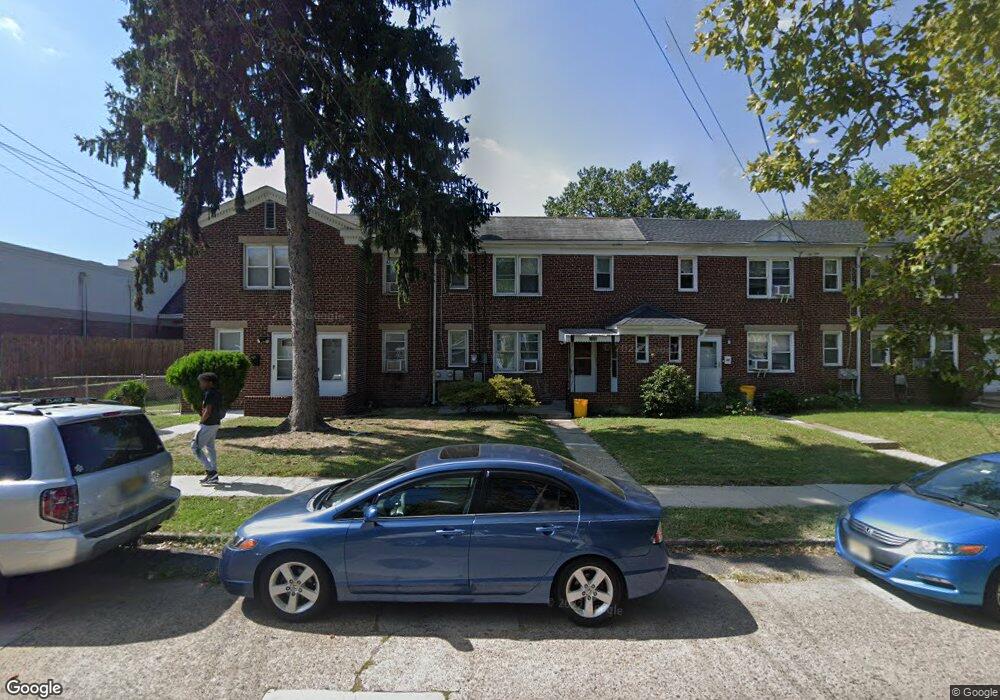
1925 47th St Pennsauken, NJ 08110
Estimated Value: $197,143 - $284,000
--
Bed
--
Bath
1,316
Sq Ft
$184/Sq Ft
Est. Value
About This Home
This home is located at 1925 47th St, Pennsauken, NJ 08110 and is currently estimated at $242,536, approximately $184 per square foot. 1925 47th St is a home located in Camden County with nearby schools including Pennsauken High School, St. Cecilia School, and Camden Forward School.
Ownership History
Date
Name
Owned For
Owner Type
Purchase Details
Closed on
Apr 28, 2008
Sold by
Erline Rental Communities Llc
Bought by
The Marcia Copeland Living Tru
Current Estimated Value
Purchase Details
Closed on
May 5, 2003
Sold by
Copeland Marcia
Bought by
Erline Rental Community
Purchase Details
Closed on
Sep 20, 2000
Sold by
Federal Housing Administration
Bought by
Copeland Marcia
Home Financials for this Owner
Home Financials are based on the most recent Mortgage that was taken out on this home.
Original Mortgage
$41,670
Interest Rate
7.83%
Create a Home Valuation Report for This Property
The Home Valuation Report is an in-depth analysis detailing your home's value as well as a comparison with similar homes in the area
Home Values in the Area
Average Home Value in this Area
Purchase History
| Date | Buyer | Sale Price | Title Company |
|---|---|---|---|
| The Marcia Copeland Living Tru | -- | -- | |
| Erline Rental Community | -- | -- | |
| Copeland Marcia | $46,308 | -- |
Source: Public Records
Mortgage History
| Date | Status | Borrower | Loan Amount |
|---|---|---|---|
| Previous Owner | Copeland Marcia | $41,670 |
Source: Public Records
Tax History Compared to Growth
Tax History
| Year | Tax Paid | Tax Assessment Tax Assessment Total Assessment is a certain percentage of the fair market value that is determined by local assessors to be the total taxable value of land and additions on the property. | Land | Improvement |
|---|---|---|---|---|
| 2025 | $4,352 | $180,500 | $45,000 | $135,500 |
| 2024 | $4,268 | $100,000 | $19,500 | $80,500 |
| 2023 | $4,268 | $100,000 | $19,500 | $80,500 |
| 2022 | $3,859 | $100,000 | $19,500 | $80,500 |
| 2021 | $3,534 | $100,000 | $19,500 | $80,500 |
| 2020 | $3,550 | $100,000 | $19,500 | $80,500 |
| 2019 | $3,591 | $100,000 | $19,500 | $80,500 |
| 2018 | $3,610 | $100,000 | $19,500 | $80,500 |
| 2017 | $3,617 | $100,000 | $19,500 | $80,500 |
| 2016 | $3,552 | $100,000 | $19,500 | $80,500 |
| 2015 | $3,658 | $100,000 | $19,500 | $80,500 |
| 2014 | $3,537 | $63,600 | $15,700 | $47,900 |
Source: Public Records
Map
Nearby Homes