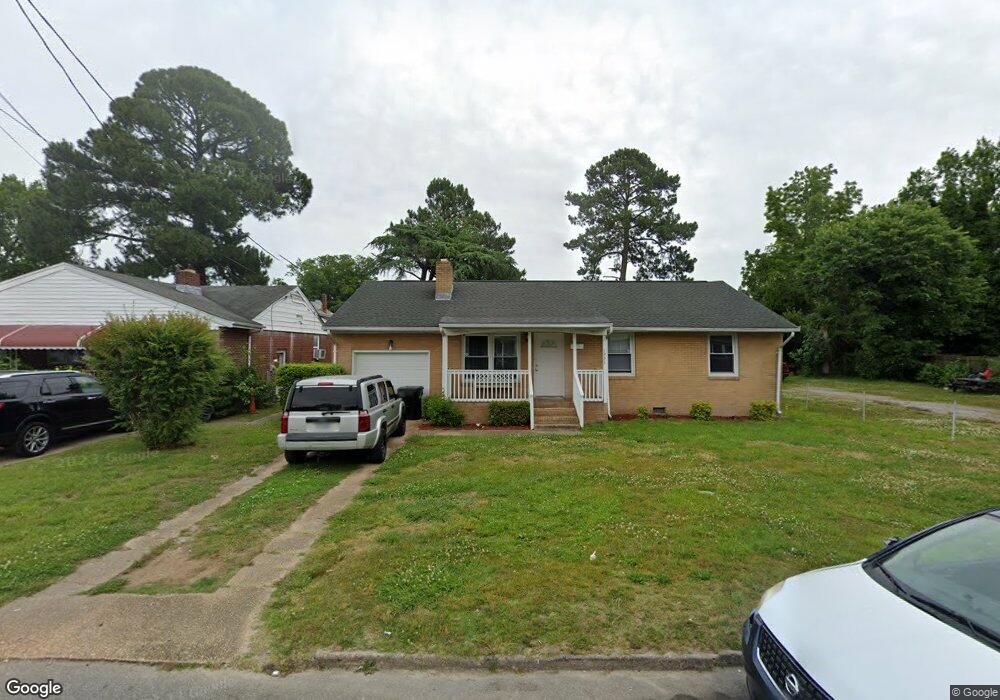
1925 Camden Ave Portsmouth, VA 23704
South Portsmouth NeighborhoodEstimated Value: $164,000 - $235,481
3
Beds
2
Baths
1,100
Sq Ft
$185/Sq Ft
Est. Value
About This Home
This home is located at 1925 Camden Ave, Portsmouth, VA 23704 and is currently estimated at $203,870, approximately $185 per square foot. 1925 Camden Ave is a home located in Portsmouth City with nearby schools including Brighton Elementary School, I.C. Norcom High School, and Court Street Academy.
Ownership History
Date
Name
Owned For
Owner Type
Purchase Details
Closed on
Mar 29, 2013
Sold by
D&B Properties Inc
Bought by
Bailey Quintin S
Current Estimated Value
Home Financials for this Owner
Home Financials are based on the most recent Mortgage that was taken out on this home.
Original Mortgage
$3,413
Outstanding Balance
$2,419
Interest Rate
3.64%
Mortgage Type
Stand Alone Second
Estimated Equity
$201,451
Purchase Details
Closed on
Nov 26, 2012
Sold by
Recontrust Company Na Sub Tr and Hinton Avery
Bought by
D And B Prop Inc
Purchase Details
Closed on
May 30, 2006
Sold by
Earley Bennie L
Bought by
Turner Garlon T
Home Financials for this Owner
Home Financials are based on the most recent Mortgage that was taken out on this home.
Original Mortgage
$45,000
Interest Rate
6.55%
Mortgage Type
New Conventional
Create a Home Valuation Report for This Property
The Home Valuation Report is an in-depth analysis detailing your home's value as well as a comparison with similar homes in the area
Home Values in the Area
Average Home Value in this Area
Purchase History
| Date | Buyer | Sale Price | Title Company |
|---|---|---|---|
| Bailey Quintin S | $97,500 | -- | |
| D And B Prop Inc | $147,250 | -- | |
| Turner Garlon T | $50,000 | -- |
Source: Public Records
Mortgage History
| Date | Status | Borrower | Loan Amount |
|---|---|---|---|
| Open | Bailey Quintin S | $3,413 | |
| Open | Bailey Quintin S | $95,733 | |
| Previous Owner | Turner Garlon T | $45,000 |
Source: Public Records
Tax History Compared to Growth
Tax History
| Year | Tax Paid | Tax Assessment Tax Assessment Total Assessment is a certain percentage of the fair market value that is determined by local assessors to be the total taxable value of land and additions on the property. | Land | Improvement |
|---|---|---|---|---|
| 2025 | $2,674 | $206,730 | $59,380 | $147,350 |
| 2024 | $2,674 | $203,530 | $59,380 | $144,150 |
| 2023 | $2,384 | $190,720 | $59,380 | $131,340 |
| 2022 | $2,144 | $164,960 | $47,500 | $117,460 |
| 2021 | $1,849 | $142,260 | $39,750 | $102,510 |
| 2020 | $1,769 | $136,090 | $37,850 | $98,240 |
| 2019 | $1,741 | $133,950 | $37,850 | $96,100 |
| 2018 | $1,741 | $133,950 | $37,850 | $96,100 |
| 2017 | $1,741 | $133,950 | $37,850 | $96,100 |
| 2016 | $1,741 | $133,950 | $37,850 | $96,100 |
| 2015 | $1,672 | $128,610 | $37,850 | $90,760 |
| 2014 | $1,633 | $128,610 | $37,850 | $90,760 |
Source: Public Records
Map
Nearby Homes
- 1919 Camden Ave
- 1908 Elm Ave
- 1902 Camden Ave
- 2008 Elm Ave
- 2010 Camden Ave
- 1918 Prentis Ave
- 2108 Camden Ave
- 1703 Camden Ave
- 2108 Atlanta Ave
- 1828 Parker Ave
- 1121 Fayette St
- 2124 Pearl St
- 1621 Elm Ave
- 2107 Pearl St
- 2111 Pearl St
- 1711 Richmond Ave
- 1906 Lasalle Ave
- 1601 Atlanta Ave
- 1623 Prentis Ave
- 1804 Richmond Ave