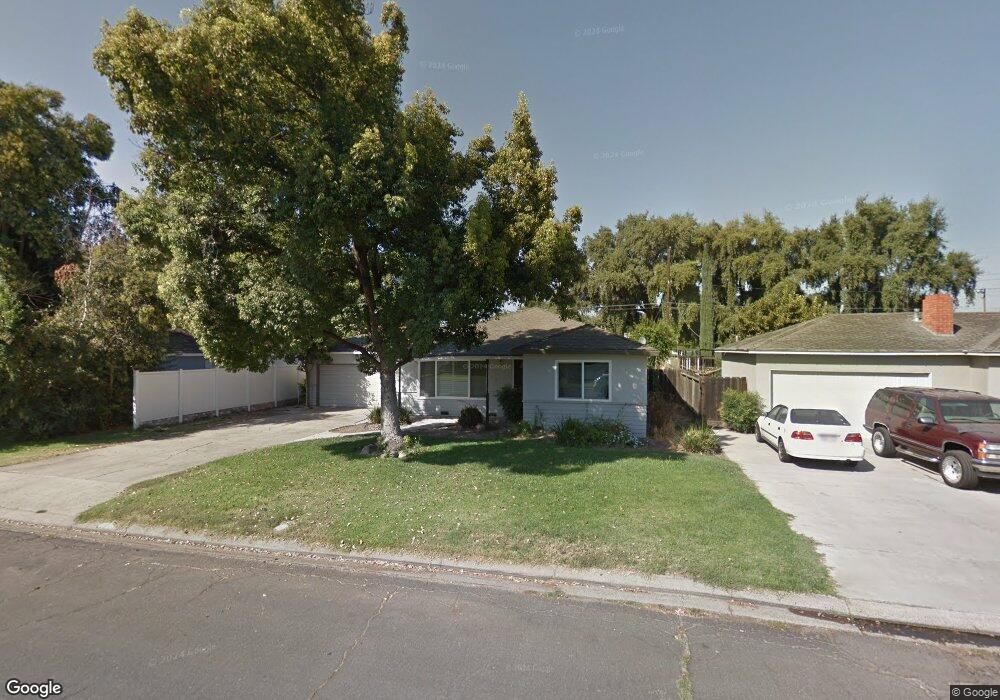
1925 Charles Place Turlock, CA 95380
Estimated Value: $535,442 - $566,000
About This Home
This home is located at 1925 Charles Place, Turlock, CA 95380 and is currently estimated at $544,111, approximately $273 per square foot. 1925 Charles Place is a home located in Stanislaus County with nearby schools including Julien Elementary School, Marvin A. Dutcher Middle School, and Turlock Junior High School.
Ownership History
We collect this data history from publicly available records. To have your information removed, we recommend requesting removal directly through your county’s website.
Purchase Details
Home Financials for this Owner
Home Financials are based on the most recent Mortgage that was taken out on this home.Purchase Details
Purchase Details
Home Financials for this Owner
Home Financials are based on the most recent Mortgage that was taken out on this home.Purchase Details
Home Financials for this Owner
Home Financials are based on the most recent Mortgage that was taken out on this home.Purchase Details
Purchase Details
Home Financials for this Owner
Home Financials are based on the most recent Mortgage that was taken out on this home.Purchase Details
Purchase Details
Home Financials for this Owner
Home Financials are based on the most recent Mortgage that was taken out on this home.Purchase Details
Home Financials for this Owner
Home Financials are based on the most recent Mortgage that was taken out on this home.Purchase Details
Home Financials for this Owner
Home Financials are based on the most recent Mortgage that was taken out on this home.Purchase History
We collect this data history from publicly available records. To have your information removed, we recommend requesting removal directly through your county’s website.
| Date | Buyer | Sale Price | Title Company |
|---|---|---|---|
| -- | Lawyers Title Sd | ||
| -- | Lawyers Title Sd | ||
| -- | None Available | ||
| -- | Accommodation | ||
| -- | Stewart Title Of California | ||
| -- | None Available | ||
| $230,000 | Ticor Title Redlands | ||
| $182,468 | Accommodation | ||
| $375,000 | Alliance Title Company | ||
| -- | Chicago Title | ||
| -- | Chicago Title Co | ||
| $125,000 | Chicago Title Co |
Mortgage History
We collect this data history from publicly available records. To have your information removed, we recommend requesting removal directly through your county’s website.
| Date | Status | Borrower | Loan Amount |
|---|---|---|---|
| Open | $285,000 | ||
| Open | $490,000 | ||
| Closed | $172,000 | ||
| Closed | $180,000 | ||
| Previous Owner | $300,000 | ||
| Previous Owner | $171,000 | ||
| Previous Owner | $113,400 | ||
| Closed | $37,500 |
Tax History
We collect this data history from publicly available records. To have your information removed, we recommend requesting removal directly through your county’s website.
| Year | Tax Paid | Tax Assessment Tax Assessment Total Assessment is a certain percentage of the fair market value that is determined by local assessors to be the total taxable value of land and additions on the property. | Land | Improvement |
|---|---|---|---|---|
| 2025 | $368 | $296,871 | $64,533 | $232,338 |
| 2024 | $3,051 | $291,051 | $63,268 | $227,783 |
| 2023 | $3,045 | $285,345 | $62,028 | $223,317 |
| 2022 | $3,005 | $279,751 | $60,812 | $218,939 |
| 2021 | $2,959 | $274,267 | $59,620 | $214,647 |
| 2020 | $2,938 | $271,456 | $59,009 | $212,447 |
| 2019 | $2,887 | $266,134 | $57,852 | $208,282 |
| 2018 | $2,883 | $260,917 | $56,718 | $204,199 |
| 2017 | $2,815 | $255,802 | $55,606 | $200,196 |
| 2016 | $2,627 | $250,787 | $54,516 | $196,271 |
| 2015 | $2,604 | $247,021 | $53,698 | $193,323 |
| 2014 | -- | $242,184 | $52,647 | $189,537 |
Map
- 1930 Charles Place
- 1871 El Camino Dr
- 164 Elena Ct
- 986 Edwards Dr
- 1438 Cahill Ave
- 2375 El Capitan Dr
- 1598 East Ave
- 1176 La Sombra Ct
- 1415 Myrtle St
- 1300 N Berkeley Ave
- 2671 El Camino Dr
- 1240 Forest Dr
- 1246 E Canal Dr
- 145 N Daubenberger Rd
- 0 Christine Way
- 1425 Forest Dr
- 2340 E Hawkeye Ave
- 716 N Daubenberger Rd
- 1460 E Hawkeye Ave
- 1109 Alpha Rd
- 1955 Charles Place
- 1895 Charles Place
- 1875 Charles Place
- 1975 Charles Place
- 1900 Charles Place
- 1855 Charles Place
- 1995 Charles Place
- 1876 Charles Place
- 1980 Charles Place
- 1856 Charles Place
- 1835 Charles Place
- 1998 Charles Place
- 1836 Charles Place
- 2000 Carrigan St
- 1815 Charles Place
- 1943 E Marshall St
- 2005 Zinfandel Ln
- 431 N Johnson Rd
- 1945 E Marshall St
- 1895 E Marshall St
Ask me questions while you tour the home.