Estimated Value: $274,000 - $311,000
--
Bed
2
Baths
2,220
Sq Ft
$131/Sq Ft
Est. Value
About This Home
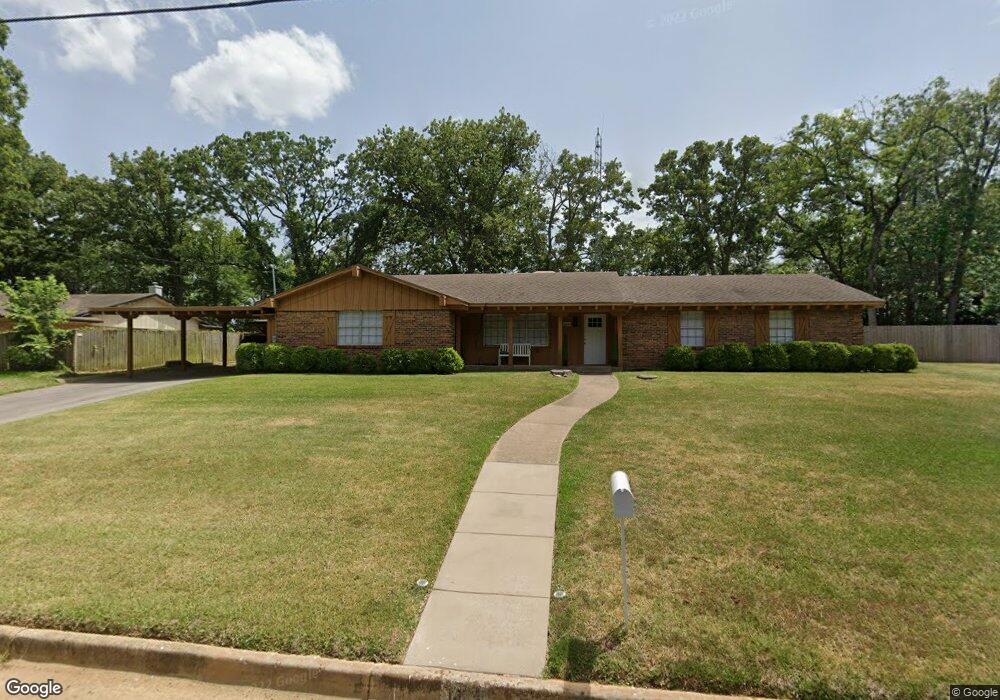
This home is located at 1925 Courtney Dr, Tyler, TX 75701 and is currently estimated at $290,244, approximately $130 per square foot. 1925 Courtney Dr is a home located in Smith County with nearby schools including Clarkston Elementary School, Hubbard Middle School, and Tyler Legacy High School.
Ownership History
Date
Name
Owned For
Owner Type
Purchase Details
Closed on
Jul 16, 2024
Sold by
Childress Adam David and Childress Trevor Martin
Bought by
Childress Regina
Current Estimated Value
Home Financials for this Owner
Home Financials are based on the most recent Mortgage that was taken out on this home.
Original Mortgage
$94,470
Outstanding Balance
$91,633
Interest Rate
6.99%
Mortgage Type
New Conventional
Estimated Equity
$198,611
Purchase Details
Closed on
Jun 20, 2017
Sold by
Belt Linde M and Estate Of Maxine Childers Trus
Bought by
Childress Larry M
Purchase Details
Closed on
Jun 7, 2006
Sold by
Rowe Ralph W and Rowe Marian G
Bought by
Childress Maxine
Home Financials for this Owner
Home Financials are based on the most recent Mortgage that was taken out on this home.
Original Mortgage
$100,000
Interest Rate
6.56%
Mortgage Type
Seller Take Back
Create a Home Valuation Report for This Property
The Home Valuation Report is an in-depth analysis detailing your home's value as well as a comparison with similar homes in the area
Home Values in the Area
Average Home Value in this Area
Purchase History
| Date | Buyer | Sale Price | Title Company |
|---|---|---|---|
| Childress Regina | -- | None Listed On Document | |
| Childress Larry M | -- | None Available | |
| Childress Maxine | -- | None Available |
Source: Public Records
Mortgage History
| Date | Status | Borrower | Loan Amount |
|---|---|---|---|
| Open | Childress Regina | $94,470 | |
| Previous Owner | Childress Maxine | $100,000 |
Source: Public Records
Tax History Compared to Growth
Tax History
| Year | Tax Paid | Tax Assessment Tax Assessment Total Assessment is a certain percentage of the fair market value that is determined by local assessors to be the total taxable value of land and additions on the property. | Land | Improvement |
|---|---|---|---|---|
| 2025 | $1,988 | $315,643 | $59,147 | $256,496 |
| 2024 | $1,988 | $232,232 | $22,050 | $277,496 |
| 2023 | $2,017 | $268,659 | $22,050 | $246,609 |
| 2022 | $4,329 | $220,968 | $17,514 | $203,454 |
| 2021 | $3,661 | $174,479 | $17,514 | $156,965 |
| 2020 | $3,534 | $165,144 | $17,514 | $147,630 |
| 2019 | $3,466 | $158,516 | $17,514 | $141,002 |
| 2018 | $3,122 | $143,528 | $12,600 | $130,928 |
| 2017 | $3,279 | $153,575 | $12,600 | $140,975 |
| 2016 | $3,209 | $150,311 | $12,600 | $137,711 |
| 2015 | $1,434 | $144,730 | $12,600 | $132,130 |
| 2014 | $1,434 | $137,458 | $12,600 | $124,858 |
Source: Public Records
Map
Nearby Homes
- 3024 Royal Garden Rd
- 2014 Miller Dr
- 2002 E Faulkner St
- 2226 Mimosa Dr
- 2026 Neeley St
- The Dawson Plan at New Home Living at Medina
- 2949 Medina Dr
- The Hubbard Plan at New Home Living at Medina
- 2716 Royal Village Way
- 2938 Dinah Ln
- 1931 Sterling Dr
- 2830 Juniper Ln
- 2929 Dinah Ln
- 1602 Dennis Dr
- 2820 Oak Knob St
- 2512 Alta Mira Dr
- 2918 Oak Knob St
- 2006 McDonald Rd
- 2010 McDonald Rd
- 2126 McDonald Rd
- 2005 Courtney Dr
- 1915 Courtney Dr
- 1918 Courtney Dr
- 2011 Courtney Dr
- 2000 Courtney Dr
- 1909 Courtney Dr
- 1907 Miller Dr
- 2015 Courtney Dr
- 2018 Courtney Dr
- 1921 Miller Dr
- 1921 1921 Miller Dr
- 2003 Miller Dr
- 1905 Courtney Dr
- 2009 Miller Dr
- 2030 Courtney Dr
- 1906 Miller Dr
- 2019 Courtney Dr
- 2015 2015 Miller
- 1910 1910 Miller Dr
- 2015 Miller Dr