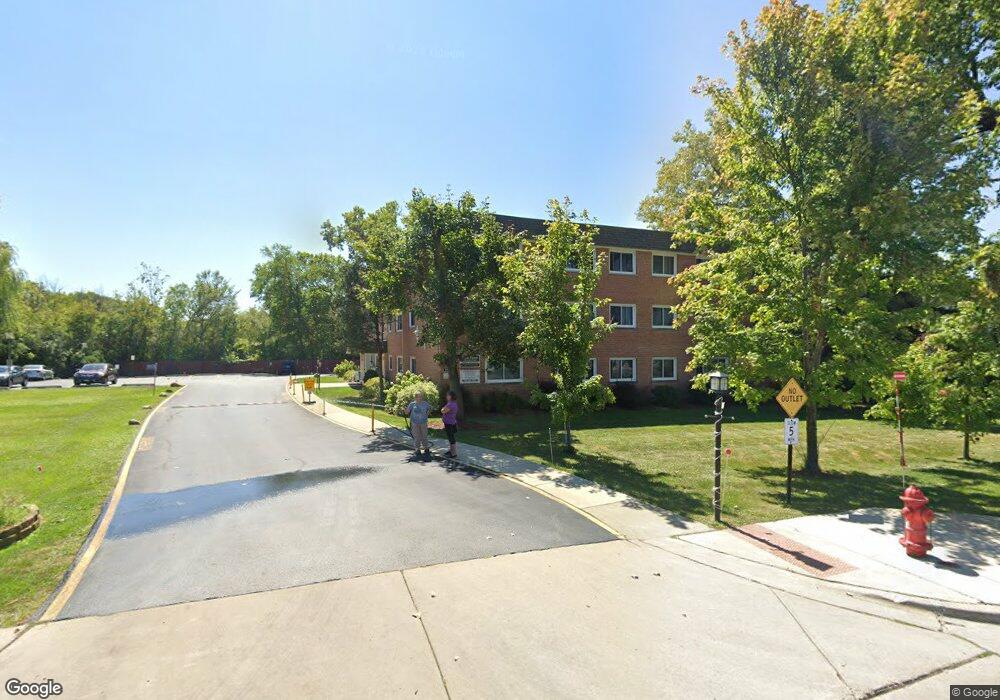
1925 E Oakton St Unit 3D Des Plaines, IL 60018
Estimated Value: $145,160 - $174,000
1
Bed
1
Bath
730
Sq Ft
$218/Sq Ft
Est. Value
About This Home
This home is located at 1925 E Oakton St Unit 3D, Des Plaines, IL 60018 and is currently estimated at $159,290, approximately $218 per square foot. 1925 E Oakton St Unit 3D is a home located in Cook County with nearby schools including South Elementary School, Algonquin Middle School, and Maine West High School.
Ownership History
Date
Name
Owned For
Owner Type
Purchase Details
Closed on
Sep 25, 2024
Sold by
Fijor Boguslaw Henryk and Sliwinska Joanna Ewa
Bought by
Fijor And Sliwinska Family Trust and Fijor
Current Estimated Value
Purchase Details
Closed on
Jun 30, 2000
Sold by
Mcallister Terry M and Mcallister Diana M
Bought by
Fijor Boguslaw and Sliwinska Joanna
Home Financials for this Owner
Home Financials are based on the most recent Mortgage that was taken out on this home.
Original Mortgage
$75,000
Interest Rate
8.55%
Purchase Details
Closed on
Apr 6, 1999
Sold by
Lewandowski Andrea and Estate Of Sally Bross
Bought by
Mcallister Terry M and Mcallister Diana M
Home Financials for this Owner
Home Financials are based on the most recent Mortgage that was taken out on this home.
Original Mortgage
$40,500
Interest Rate
6.94%
Create a Home Valuation Report for This Property
The Home Valuation Report is an in-depth analysis detailing your home's value as well as a comparison with similar homes in the area
Home Values in the Area
Average Home Value in this Area
Purchase History
| Date | Buyer | Sale Price | Title Company |
|---|---|---|---|
| Fijor And Sliwinska Family Trust | -- | None Listed On Document | |
| Fijor Boguslaw | -- | Chicago Title Insurance Co | |
| Mcallister Terry M | $45,000 | Ticor Title |
Source: Public Records
Mortgage History
| Date | Status | Borrower | Loan Amount |
|---|---|---|---|
| Previous Owner | Fijor Boguslaw | $75,000 | |
| Previous Owner | Mcallister Terry M | $40,500 |
Source: Public Records
Tax History
| Year | Tax Paid | Tax Assessment Tax Assessment Total Assessment is a certain percentage of the fair market value that is determined by local assessors to be the total taxable value of land and additions on the property. | Land | Improvement |
|---|---|---|---|---|
| 2025 | -- | $13,625 | $2,416 | $11,209 |
| 2024 | -- | $9,197 | $2,014 | $7,183 |
| 2023 | -- | $9,197 | $2,014 | $7,183 |
| 2022 | $0 | $9,197 | $2,014 | $7,183 |
| 2021 | $181 | $7,591 | $1,678 | $5,913 |
| 2020 | $181 | $7,591 | $1,678 | $5,913 |
| 2019 | $0 | $8,569 | $1,678 | $6,891 |
| 2018 | $181 | $4,729 | $1,476 | $3,253 |
| 2017 | $199 | $4,729 | $1,476 | $3,253 |
| 2016 | $422 | $4,729 | $1,476 | $3,253 |
| 2015 | $375 | $4,614 | $1,275 | $3,339 |
| 2014 | $388 | $4,614 | $1,275 | $3,339 |
| 2013 | -- | $4,614 | $1,275 | $3,339 |
Source: Public Records
Map
Nearby Homes
- 1640 S River Rd
- 1990 Berry Ln
- 1700 E Forest Ave
- 1721 Prospect Ave
- 1645 Illinois St
- 1689 S Elm St
- 1696 S Elm St
- 1509 Center St
- 1922 Fargo Ave
- 1445 Everett Ave
- 1630 Henry Ave
- 700 Florence Dr
- 1638 Oakwood Ave
- 1649 Ashland Ave Unit 501
- 1524 Oakwood Ave
- 1705 Pavilion Way Unit 303
- 1600 E Thacker St Unit 513
- 1715 Pavilion Way Unit 206
- 1731 Pavilion Way Unit 405
- 38 E Touhy Ave
- 1925 E Oakton St Unit 3G
- 1925 E Oakton St Unit 3A
- 1925 E Oakton St Unit 3H
- 1925 E Oakton St Unit 2E
- 1925 E Oakton St Unit 1A
- 1925 E Oakton St Unit 2H
- 1925 E Oakton St Unit 1F
- 1925 E Oakton St Unit 2C
- 1925 E Oakton St Unit 2F
- 1925 E Oakton St Unit 1G
- 1925 E Oakton St Unit 1E
- 1925 E Oakton St Unit 3E
- 1925 E Oakton St Unit 1C
- 1925 E Oakton St Unit 3B
- 1925 E Oakton St Unit 2B
- 1925 E Oakton St Unit 3F
- 1925 E Oakton St Unit 2G
- 1925 E Oakton St Unit 2A
- 1925 E Oakton St Unit 2D
Your Personal Tour Guide
Ask me questions while you tour the home.