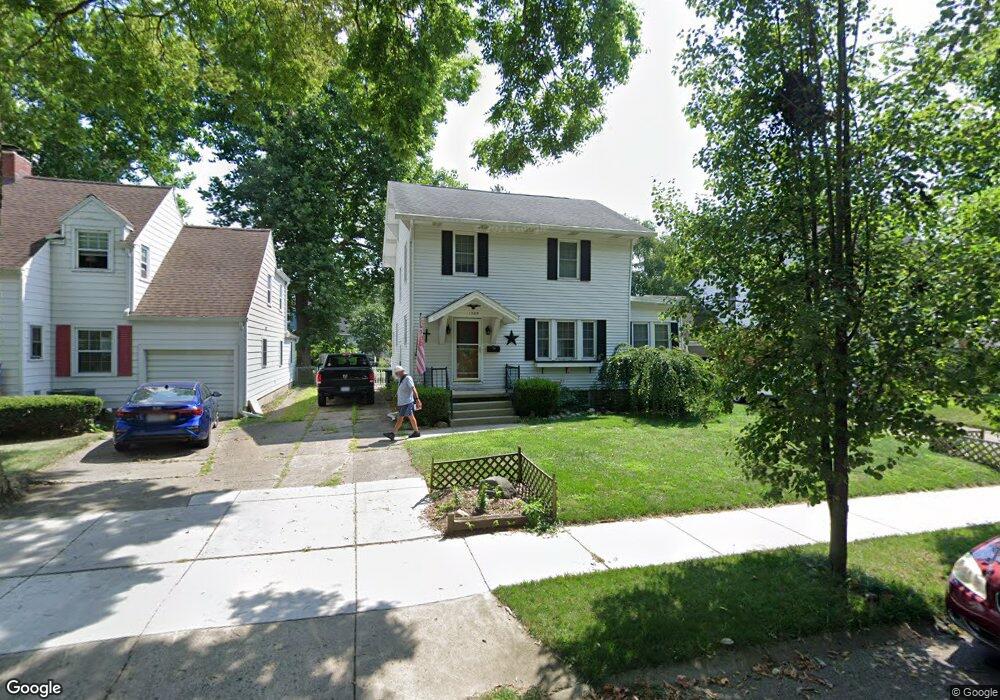
1925 Harshman Blvd Springfield, OH 45504
Estimated Value: $163,486 - $216,000
3
Beds
1
Bath
1,509
Sq Ft
$118/Sq Ft
Est. Value
About This Home
This home is located at 1925 Harshman Blvd, Springfield, OH 45504 and is currently estimated at $177,872, approximately $117 per square foot. 1925 Harshman Blvd is a home located in Clark County with nearby schools including Snyder Park Elementary School, Roosevelt Middle School, and Springfield High School.
Ownership History
Date
Name
Owned For
Owner Type
Purchase Details
Closed on
Sep 6, 2016
Sold by
Barrett Brian W and Barrett Monica L
Bought by
Jahna Robert H
Current Estimated Value
Home Financials for this Owner
Home Financials are based on the most recent Mortgage that was taken out on this home.
Original Mortgage
$96,662
Outstanding Balance
$76,706
Interest Rate
3.48%
Mortgage Type
VA
Estimated Equity
$101,166
Purchase Details
Closed on
Aug 15, 2008
Sold by
Jarrell William V and Jarrell Ruth A
Bought by
Barrett Brian W and Barrett Monica L
Home Financials for this Owner
Home Financials are based on the most recent Mortgage that was taken out on this home.
Original Mortgage
$98,100
Interest Rate
6.39%
Mortgage Type
Purchase Money Mortgage
Purchase Details
Closed on
Oct 3, 1994
Sold by
Brenning Orin Z
Bought by
Jarrell William V and Jarrell Ruth
Home Financials for this Owner
Home Financials are based on the most recent Mortgage that was taken out on this home.
Original Mortgage
$82,110
Interest Rate
9%
Mortgage Type
VA
Create a Home Valuation Report for This Property
The Home Valuation Report is an in-depth analysis detailing your home's value as well as a comparison with similar homes in the area
Home Values in the Area
Average Home Value in this Area
Purchase History
| Date | Buyer | Sale Price | Title Company |
|---|---|---|---|
| Jahna Robert H | $102,000 | None Available | |
| Barrett Brian W | $106,000 | Rels Title | |
| Jarrell William V | $80,500 | -- |
Source: Public Records
Mortgage History
| Date | Status | Borrower | Loan Amount |
|---|---|---|---|
| Open | Jahna Robert H | $96,662 | |
| Previous Owner | Barrett Brian W | $98,100 | |
| Previous Owner | Jarrell William V | $82,110 |
Source: Public Records
Tax History
| Year | Tax Paid | Tax Assessment Tax Assessment Total Assessment is a certain percentage of the fair market value that is determined by local assessors to be the total taxable value of land and additions on the property. | Land | Improvement |
|---|---|---|---|---|
| 2025 | $1,931 | $54,370 | $8,570 | $45,800 |
| 2024 | $1,880 | $39,020 | $7,470 | $31,550 |
| 2023 | $1,880 | $39,020 | $7,470 | $31,550 |
| 2022 | $1,926 | $39,020 | $7,470 | $31,550 |
| 2021 | $1,713 | $32,040 | $6,120 | $25,920 |
| 2020 | $1,717 | $32,040 | $6,120 | $25,920 |
| 2019 | $1,721 | $32,040 | $6,120 | $25,920 |
| 2018 | $1,447 | $25,870 | $5,830 | $20,040 |
| 2017 | $1,446 | $28,869 | $5,828 | $23,041 |
| 2016 | $1,448 | $28,869 | $5,828 | $23,041 |
| 2015 | $1,642 | $28,869 | $5,828 | $23,041 |
| 2014 | $1,634 | $28,869 | $5,828 | $23,041 |
| 2013 | $1,617 | $28,869 | $5,828 | $23,041 |
Source: Public Records
Map
Nearby Homes
- 1866 Maiden Ln
- 1715 W North St
- 1524 W North St Unit 1526
- 40 Zischler St
- 1906-1908 W High St
- 106 Walter St
- 110 Walter St
- 1420 Parker Ct
- 22 Seever St
- 1828 W Washington St
- 1500 W Main St
- 1915 W Washington St
- 1504 W High St
- 202 Seever St
- 1417 W Main St
- 366 N Isabella St
- 1015 Hillcrest Ave
- 1225 W High St
- 1618 W Pleasant St
- 1205 W High St
- 1931 Harshman Blvd
- 1909 Harshman Blvd
- 1935 Harshman Blvd
- 1941 Harshman Blvd
- 1905 Harshman Blvd
- 1920 Broadway St
- 1924 Broadway St
- 1910 Broadway St
- 1947 Harshman Blvd
- 1930 Broadway St
- 1901 Harshman Blvd
- 1906 Broadway St
- 1936 Broadway St
- 1902 Broadway St
- 1951 Harshman Blvd
- 1938 Broadway St
- 1875 Overlook Dr
- 1944 Broadway St
- 1876 Broadway St
- 460 Snyder St
Your Personal Tour Guide
Ask me questions while you tour the home.