Estimated Value: $204,000 - $325,000
2
Beds
2
Baths
2,016
Sq Ft
$142/Sq Ft
Est. Value
About This Home
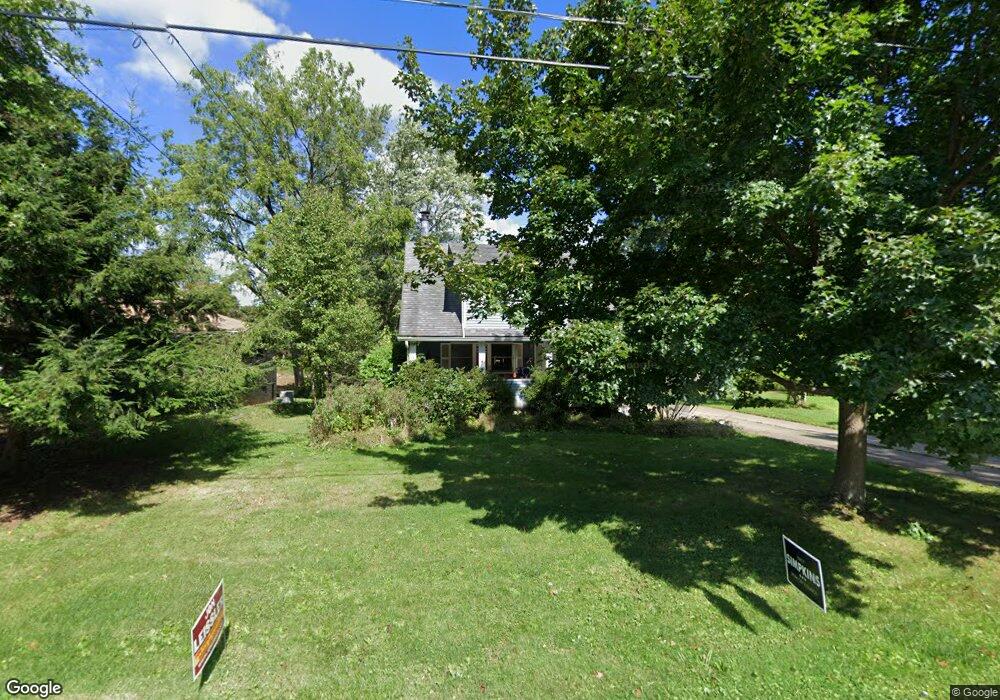
This home is located at 1925 Maple Rd, Stow, OH 44224 and is currently estimated at $286,375, approximately $142 per square foot. 1925 Maple Rd is a home located in Summit County with nearby schools including Stow-Munroe Falls High School, Holy Family Elementary School, and Walsh Jesuit High School.
Ownership History
Date
Name
Owned For
Owner Type
Purchase Details
Closed on
Jul 12, 2010
Sold by
Hsbc Bank Usa National Association
Bought by
Smith Tammy Jo
Current Estimated Value
Purchase Details
Closed on
Apr 1, 2010
Sold by
Daerr Michele Lynn and Daerr Nicholas L
Bought by
Hsbc Bank Usa National Association
Purchase Details
Closed on
Dec 26, 2000
Sold by
Geopfert Thomas Jacob and Geopfert Jean M
Bought by
Daerr Nicholas L and Daerr Michele Lynn
Home Financials for this Owner
Home Financials are based on the most recent Mortgage that was taken out on this home.
Original Mortgage
$133,200
Interest Rate
7.77%
Create a Home Valuation Report for This Property
The Home Valuation Report is an in-depth analysis detailing your home's value as well as a comparison with similar homes in the area
Home Values in the Area
Average Home Value in this Area
Purchase History
| Date | Buyer | Sale Price | Title Company |
|---|---|---|---|
| Smith Tammy Jo | $88,000 | None Available | |
| Hsbc Bank Usa National Association | $104,000 | None Available | |
| Daerr Nicholas L | $148,000 | Falls Title Agency Inc |
Source: Public Records
Mortgage History
| Date | Status | Borrower | Loan Amount |
|---|---|---|---|
| Previous Owner | Daerr Nicholas L | $133,200 |
Source: Public Records
Tax History
| Year | Tax Paid | Tax Assessment Tax Assessment Total Assessment is a certain percentage of the fair market value that is determined by local assessors to be the total taxable value of land and additions on the property. | Land | Improvement |
|---|---|---|---|---|
| 2025 | $5,081 | $90,139 | $14,896 | $75,243 |
| 2024 | $5,081 | $90,139 | $14,896 | $75,243 |
| 2023 | $5,081 | $90,139 | $14,896 | $75,243 |
| 2022 | $4,044 | $63,193 | $10,416 | $52,777 |
| 2021 | $3,621 | $63,193 | $10,416 | $52,777 |
| 2020 | $3,559 | $63,200 | $10,420 | $52,780 |
| 2019 | $2,937 | $48,580 | $9,450 | $39,130 |
| 2018 | $2,890 | $48,580 | $9,450 | $39,130 |
| 2017 | $2,971 | $48,580 | $9,450 | $39,130 |
| 2016 | $3,057 | $48,580 | $9,450 | $39,130 |
| 2015 | $2,971 | $48,580 | $9,450 | $39,130 |
| 2014 | $2,973 | $48,580 | $9,450 | $39,130 |
| 2013 | $2,872 | $47,210 | $9,450 | $37,760 |
Source: Public Records
Map
Nearby Homes
- 72 Pinehurst Rd
- 3355 Sycamore Dr
- 3550 Sanford Ave
- 3564 Williamson Rd
- 3068 Kent Rd Unit 105
- 3066 Kent Rd Unit 112
- 3064 Kent Rd Unit 403
- 3068 Kent Rd
- 245 Bermont Ave
- 431 Trudy Ave
- 3665 Marcella Ave
- 3679 Sanford Ave
- 66 Falling Water Cir Unit 38
- 3846 Charring Cross Dr
- 3820 Seneca St
- 374 N River Rd
- 3828 Osage St Unit 3832
- 3905 Kent Rd
- 1231 Graham Rd
- 3114 W Edgerton Rd
- 1923 Maple Rd
- 1921 Maple Rd Unit 1923
- 1935 Maple Rd
- 3327 Darrow Rd
- 1945 Maple Rd
- 1916 Maple Rd
- 1903 Maple Rd
- 3337 Darrow Rd
- 1946 Maple Rd
- 1936 Maple Rd
- 3301 Darrow Rd
- 1955 Maple Rd
- 1928 Hawthorne Ave
- 1928 Hawthorne Ave
- 1934 Hawthorne Ave
- 3291 Darrow Rd
- 1920 Hawthorne Ave
- 1942 Hawthorne Ave
- 1956 Maple Rd
- 3281 Darrow Rd
Your Personal Tour Guide
Ask me questions while you tour the home.