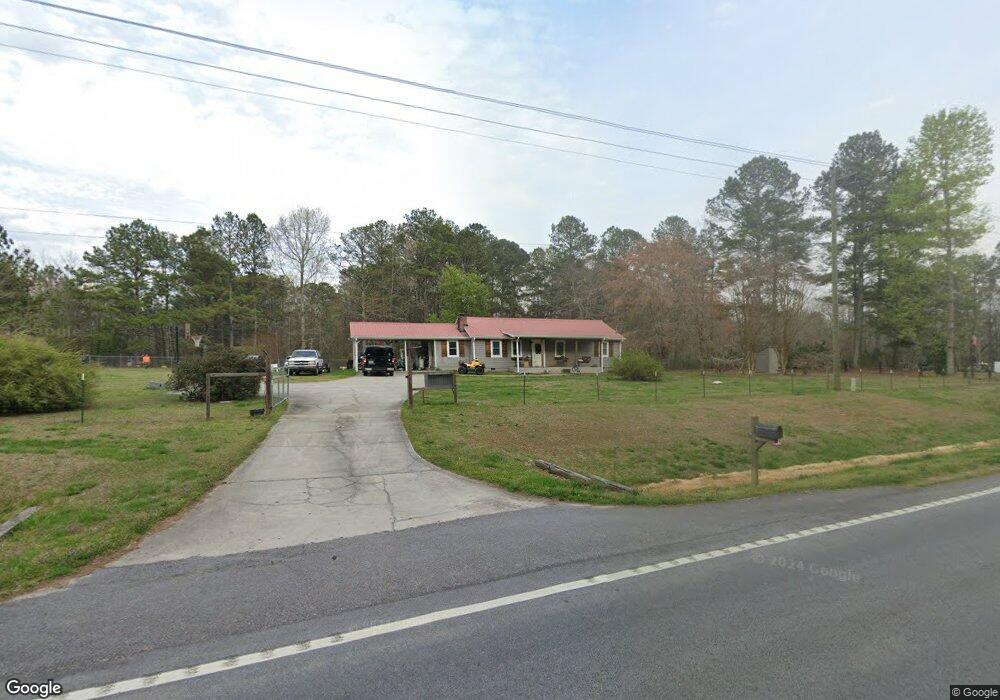
1925 N Highway 113 Temple, GA 30179
Estimated Value: $236,642 - $295,000
2
Beds
2
Baths
1,144
Sq Ft
$232/Sq Ft
Est. Value
About This Home
This home is located at 1925 N Highway 113, Temple, GA 30179 and is currently estimated at $264,911, approximately $231 per square foot. 1925 N Highway 113 is a home located in Haralson County with nearby schools including Haralson County High School.
Ownership History
Date
Name
Owned For
Owner Type
Purchase Details
Closed on
Nov 8, 2017
Sold by
Smith Lloyd A
Bought by
Williams Paul Michael and Williams Hannah Marie
Current Estimated Value
Home Financials for this Owner
Home Financials are based on the most recent Mortgage that was taken out on this home.
Original Mortgage
$75,150
Outstanding Balance
$62,622
Interest Rate
3.91%
Mortgage Type
New Conventional
Estimated Equity
$202,289
Purchase Details
Closed on
Nov 21, 2003
Sold by
Smith Lloyd A and Deceased Doris R
Bought by
Smith Lloyd A and Smith Debra Y
Purchase Details
Closed on
May 20, 1997
Sold by
Carroll
Bought by
Cruse C E
Purchase Details
Closed on
Sep 23, 1996
Sold by
Smith Lloyd A
Bought by
Smith Lloyd A and Smith Doris R
Purchase Details
Closed on
Jan 1, 1987
Bought by
Cruse C E
Create a Home Valuation Report for This Property
The Home Valuation Report is an in-depth analysis detailing your home's value as well as a comparison with similar homes in the area
Home Values in the Area
Average Home Value in this Area
Purchase History
We collect this data history from publicly available records. To have your information removed, we recommend requesting removal directly through your county’s website.
| Date | Buyer | Sale Price | Title Company |
|---|---|---|---|
| Williams Paul Michael | $83,500 | -- | |
| Smith Lloyd A | -- | -- | |
| Cruse C E | -- | -- | |
| Smith Lloyd A | -- | -- | |
| Smith Lloyd A | $62,000 | -- | |
| Cruse C E | -- | -- |
Source: Public Records
Mortgage History
We collect this data history from publicly available records. To have your information removed, we recommend requesting removal directly through your county’s website.
| Date | Status | Borrower | Loan Amount |
|---|---|---|---|
| Open | Williams Paul Michael | $75,150 |
Source: Public Records
Tax History
| Year | Tax Paid | Tax Assessment Tax Assessment Total Assessment is a certain percentage of the fair market value that is determined by local assessors to be the total taxable value of land and additions on the property. | Land | Improvement |
|---|---|---|---|---|
| 2025 | $1,757 | $83,214 | $6,800 | $76,414 |
| 2024 | $1,315 | $50,713 | $2,200 | $48,513 |
| 2023 | $1,357 | $50,596 | $2,024 | $48,572 |
| 2022 | $1,123 | $41,886 | $2,024 | $39,862 |
| 2021 | $898 | $32,147 | $1,965 | $30,182 |
| 2020 | $931 | $33,177 | $1,965 | $31,212 |
| 2019 | $956 | $32,822 | $1,965 | $30,857 |
| 2018 | $970 | $32,822 | $1,965 | $30,857 |
| 2017 | $704 | $27,735 | $1,965 | $25,770 |
| 2016 | $756 | $26,679 | $3,400 | $23,279 |
| 2015 | $740 | $26,140 | $3,400 | $22,740 |
| 2014 | $739 | $26,481 | $3,400 | $23,081 |
Source: Public Records
Map
Nearby Homes
- 2505 Liberty Church Rd
- 127 Muirwood Dr
- 788 Nix Rd
- 1334 N Highway 113
- 972 Seventh Court Ground Rd
- 670 Spiva Rd
- 710 Spiva Rd
- 349 Morgan Rd
- 2930 N Highway 113
- 226 Waddell Rd
- 505 Miranda Way
- 169 Rachel Blvd
- 1307 Temple Draketown Rd
- 178 Rachel Blvd
- 248 Webster Lake Dr
- 119 Meadowview Dr
- 125 Meadowview Dr
- 121 Meadowview Dr
- 117 Meadowview Dr
- 115 Meadowview Dr
- 1963 N Highway 113
- 1905 N Highway 113
- 0 Buchanan Hwy Unit 10218039
- 0 Buchanan Hwy Unit 10019973
- 0 Buchanan Hwy Unit 10130588
- 0 Buchanan Hwy Unit 7175317
- 0 Buchanan Hwy Unit 10005708
- 0 Buchanan Hwy Unit 9039551
- 0 Buchanan Hwy Unit 6935117
- 0 Buchanan Hwy Unit 8694710
- 0 Buchanan Hwy Unit 8871233
- 0 Buchanan Hwy
- 2041 N Highway 113
- 2039 N Highway 113
- 1294 Morgan Rd
- 3215 Morgan Rd
- 1234 Morgan Rd
- 1229 Morgan Rd
- 1910 N Highway 113
- 1202 Morgan Rd
Your Personal Tour Guide
Ask me questions while you tour the home.