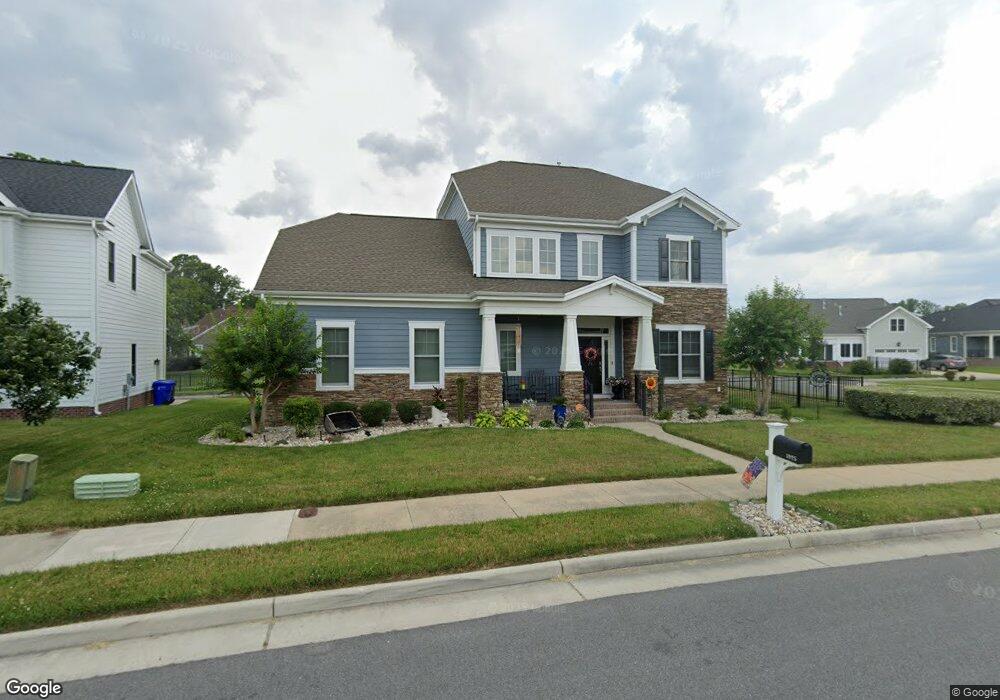
1925 Piedmont Rd Unit Rd Suffolk, VA 23435
Sleepy Hole NeighborhoodEstimated Value: $541,275 - $570,000
3
Beds
3
Baths
2,683
Sq Ft
$208/Sq Ft
Est. Value
About This Home
This home is located at 1925 Piedmont Rd Unit Rd, Suffolk, VA 23435 and is currently estimated at $557,569, approximately $207 per square foot. 1925 Piedmont Rd Unit Rd is a home located in Suffolk City with nearby schools including Creekside Elementary School, John Yeates Middle School, and Nansemond River High School.
Ownership History
Date
Name
Owned For
Owner Type
Purchase Details
Closed on
Mar 18, 2022
Sold by
Trotter Tegan
Bought by
Trotter Tegan and Ragle Harley Ray
Current Estimated Value
Purchase Details
Closed on
Jul 26, 2021
Sold by
Patterson Carl Andre and Patterson Trina T
Bought by
Trotter Tegan
Home Financials for this Owner
Home Financials are based on the most recent Mortgage that was taken out on this home.
Original Mortgage
$450,660
Interest Rate
2.93%
Mortgage Type
VA
Purchase Details
Closed on
Sep 25, 2014
Sold by
Parkside At Bennetts Creek Llc
Bought by
Patterson Carl Andre
Home Financials for this Owner
Home Financials are based on the most recent Mortgage that was taken out on this home.
Original Mortgage
$392,454
Interest Rate
4.12%
Mortgage Type
VA
Create a Home Valuation Report for This Property
The Home Valuation Report is an in-depth analysis detailing your home's value as well as a comparison with similar homes in the area
Home Values in the Area
Average Home Value in this Area
Purchase History
| Date | Buyer | Sale Price | Title Company |
|---|---|---|---|
| Trotter Tegan | -- | None Listed On Document | |
| Trotter Tegan | $435,000 | Attorney | |
| Patterson Carl Andre | $392,454 | -- |
Source: Public Records
Mortgage History
| Date | Status | Borrower | Loan Amount |
|---|---|---|---|
| Previous Owner | Trotter Tegan | $450,660 | |
| Previous Owner | Patterson Carl Andre | $392,454 |
Source: Public Records
Tax History Compared to Growth
Tax History
| Year | Tax Paid | Tax Assessment Tax Assessment Total Assessment is a certain percentage of the fair market value that is determined by local assessors to be the total taxable value of land and additions on the property. | Land | Improvement |
|---|---|---|---|---|
| 2024 | $6,255 | $529,300 | $91,700 | $437,600 |
| 2023 | $6,057 | $493,000 | $91,700 | $401,300 |
| 2022 | $4,921 | $451,500 | $91,700 | $359,800 |
| 2021 | $4,670 | $420,700 | $76,400 | $344,300 |
| 2020 | $4,365 | $393,200 | $76,400 | $316,800 |
| 2019 | $4,429 | $399,000 | $76,400 | $322,600 |
| 2018 | $4,523 | $402,600 | $76,400 | $326,200 |
| 2017 | $4,308 | $402,600 | $76,400 | $326,200 |
| 2016 | $4,308 | $402,600 | $76,400 | $326,200 |
| 2015 | $385 | $402,600 | $76,400 | $326,200 |
| 2014 | $385 | $402,600 | $76,400 | $326,200 |
Source: Public Records
Map
Nearby Homes
- Lot197 Raintree Cir
- L195 Raintree Cir
- L188 Raintree Cir
- 3419 Raintree Cir
- 1474 Elderberry Rd
- MM Lafayette
- MM Wescott
- MM Palermo Dr
- MM Milan Ln
- 2099 Piedmont Rd
- 3726 Willow Glenn Cir
- 3747 Willow Glenn Cir
- 1011 Serene Rd Unit 104
- 1009 Serene Rd Unit 103
- 1009 Serene Rd Unit 101
- 1009 Serene Rd Unit 100
- 1005 Ventana St Unit 101
- 1005 Ventana St Unit 103
- 1005 Ventana St Unit 100
- 1005 Ventana St Unit 104
- 1925 Piedmont Rd
- 1923 Piedmont Rd
- 3311 Forsythia Ct
- 3742 Raintree Cir
- 1927 Piedmont Rd
- 1921 Piedmont Rd
- 1924 Piedmont Rd
- 1926 Piedmont Rd
- 3480 Raintree Cir
- 1922 Piedmont Rd
- 3313 Forsythia Ct
- 1928 Piedmont Rd
- 3302 Forsythia Ct
- 1929 Piedmont Rd
- 1919 Piedmont Rd
- Lot 11 Selby Ct
- 203 Creek Front Ln
- 13A Clifton Lot 1 3 5 Rd
- 1.58AC Pughsville Rd
- 2.15AC Pughsville Rd