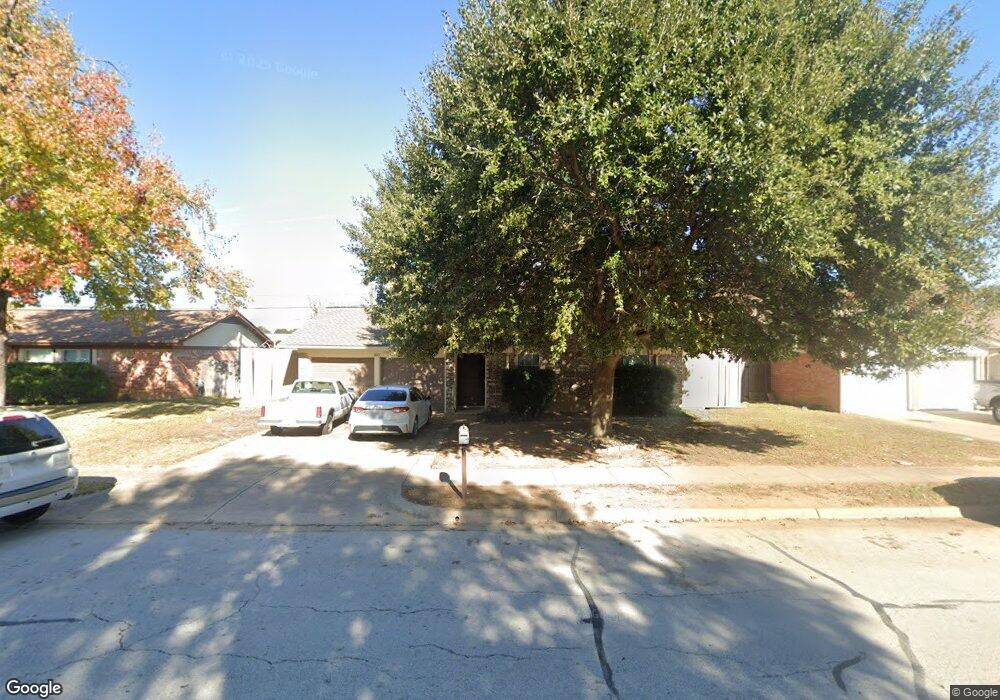
1925 Schumac Ln Bedford, TX 76022
Estimated Value: $285,000 - $400,000
4
Beds
2
Baths
1,201
Sq Ft
$276/Sq Ft
Est. Value
About This Home
This home is located at 1925 Schumac Ln, Bedford, TX 76022 and is currently estimated at $331,178, approximately $275 per square foot. 1925 Schumac Ln is a home located in Tarrant County with nearby schools including Bell Manor Elementary School, Central J High School, and Trinity High School.
Ownership History
Date
Name
Owned For
Owner Type
Purchase Details
Closed on
Sep 16, 2021
Sold by
Sterling Alicia
Bought by
Johnson Donald
Current Estimated Value
Home Financials for this Owner
Home Financials are based on the most recent Mortgage that was taken out on this home.
Original Mortgage
$270,750
Interest Rate
2.8%
Mortgage Type
New Conventional
Purchase Details
Closed on
Mar 23, 2007
Sold by
Sterling Garry Mark
Bought by
Sterling Cindy L
Purchase Details
Closed on
Jul 9, 1999
Sold by
Moore Bob G and Moore Lyla Ruth
Bought by
Sterling Garry and Sterling Cindy
Home Financials for this Owner
Home Financials are based on the most recent Mortgage that was taken out on this home.
Original Mortgage
$71,062
Interest Rate
7.39%
Create a Home Valuation Report for This Property
The Home Valuation Report is an in-depth analysis detailing your home's value as well as a comparison with similar homes in the area
Home Values in the Area
Average Home Value in this Area
Purchase History
| Date | Buyer | Sale Price | Title Company |
|---|---|---|---|
| Johnson Donald | -- | Lawyers Title | |
| Sterling Cindy L | -- | None Available | |
| Sterling Garry | -- | -- |
Source: Public Records
Mortgage History
| Date | Status | Borrower | Loan Amount |
|---|---|---|---|
| Previous Owner | Johnson Donald | $270,750 | |
| Previous Owner | Sterling Garry | $71,062 | |
| Closed | Sterling Cindy L | $0 |
Source: Public Records
Tax History Compared to Growth
Tax History
| Year | Tax Paid | Tax Assessment Tax Assessment Total Assessment is a certain percentage of the fair market value that is determined by local assessors to be the total taxable value of land and additions on the property. | Land | Improvement |
|---|---|---|---|---|
| 2025 | $1,196 | $290,375 | $65,000 | $225,375 |
| 2024 | $1,196 | $290,375 | $65,000 | $225,375 |
| 2023 | $3,784 | $270,487 | $45,000 | $225,487 |
| 2022 | $3,917 | $256,509 | $45,000 | $211,509 |
| 2021 | $3,841 | $163,043 | $45,000 | $118,043 |
| 2020 | $4,162 | $192,949 | $45,000 | $147,949 |
| 2019 | $3,866 | $194,345 | $45,000 | $149,345 |
| 2018 | $3,133 | $144,680 | $23,000 | $121,680 |
| 2017 | $3,182 | $148,464 | $23,000 | $125,464 |
| 2016 | $2,893 | $133,376 | $23,000 | $110,376 |
| 2015 | $2,455 | $108,700 | $18,000 | $90,700 |
| 2014 | $2,455 | $108,700 | $18,000 | $90,700 |
Source: Public Records
Map
Nearby Homes
- 2025 Schumac Ln
- 2201 Greendale Ct
- 1213 Greendale Dr
- 2024 Charleston Dr
- 1701 Winchester Way
- 2101 Gettysburg Place
- 933 Charleston Ct
- 952 Charleston Dr
- 1049 Stableway Ln
- 1116 Highpoint Rd
- 2421 Creek Villas Dr
- 1613 Trinity Ct
- 804 Natchez Ave
- 828 Gregory Ave
- 1604 Richmond Dr
- 2428 Chestnut Way
- 1509 Shirley Way
- 2420 Dalewood Ln
- 808 Gregory Ave
- 800 Prestwick St
- 1921 Schumac Ln
- 1929 Schumac Ln
- 1933 Schumac Ln
- 1917 Schumac Ln
- 1924 Schumac Ln
- 1928 Schumac Ln
- 1920 Schumac Ln
- 1937 Schumac Ln
- 1932 Schumac Ln
- 1216 Winchester Way
- 2001 Schumac Ln
- 1936 Schumac Ln
- 1913 Schumac Ln
- 1921 Memphis Dr
- 1925 Memphis Dr
- 1917 Memphis Dr
- 2000 Schumac Ln
- 1929 Memphis Dr
- 1912 Schumac Ln
- 2005 Schumac Ln