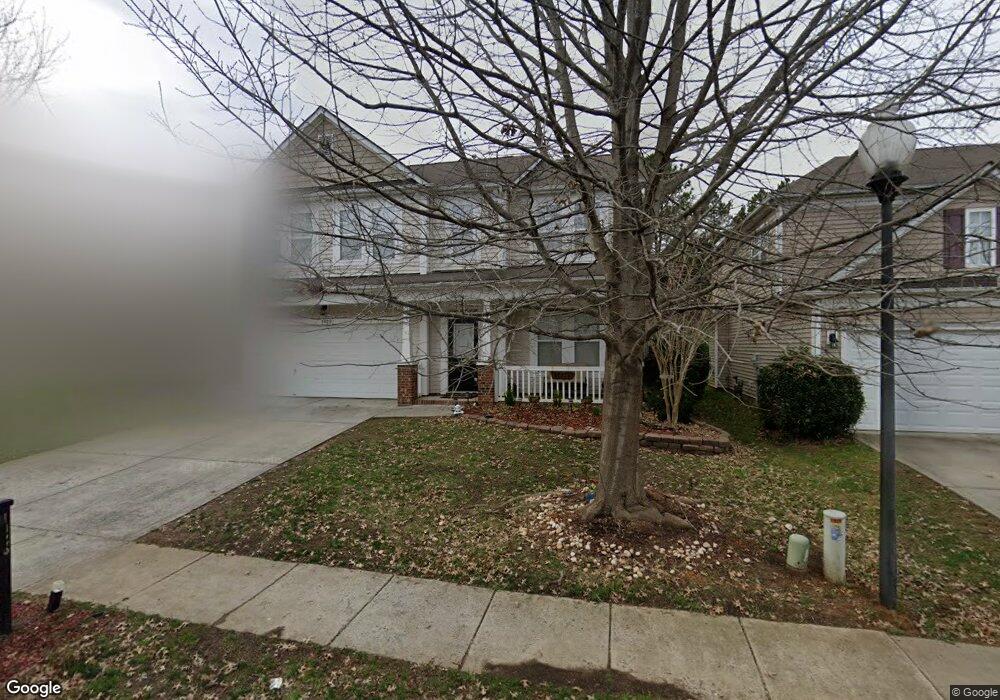
1925 Wilburn Park Ln NW Charlotte, NC 28269
Estimated Value: $449,000 - $490,000
4
Beds
3
Baths
2,615
Sq Ft
$177/Sq Ft
Est. Value
About This Home
This home is located at 1925 Wilburn Park Ln NW, Charlotte, NC 28269 and is currently estimated at $463,413, approximately $177 per square foot. 1925 Wilburn Park Ln NW is a home located in Cabarrus County with nearby schools including Cox Mill Elementary School, Harold E. Winkler Middle School, and Cox Mill High School.
Ownership History
Date
Name
Owned For
Owner Type
Purchase Details
Closed on
Sep 30, 2016
Sold by
Haviland Erik J and Haviland Gena A
Bought by
Ramesh Abilahs
Current Estimated Value
Purchase Details
Closed on
Aug 20, 2007
Sold by
Bachmeier Alan J and Bachmeier Jessica J
Bought by
Haviland Erik J and Haviland Gena A
Home Financials for this Owner
Home Financials are based on the most recent Mortgage that was taken out on this home.
Original Mortgage
$206,100
Interest Rate
10.7%
Mortgage Type
Balloon
Purchase Details
Closed on
Feb 16, 2006
Sold by
Mulvaney Homes Inc
Bought by
Bachmeier Alan J and Bachmeier Jessica J
Home Financials for this Owner
Home Financials are based on the most recent Mortgage that was taken out on this home.
Original Mortgage
$172,755
Interest Rate
6.28%
Mortgage Type
Fannie Mae Freddie Mac
Create a Home Valuation Report for This Property
The Home Valuation Report is an in-depth analysis detailing your home's value as well as a comparison with similar homes in the area
Home Values in the Area
Average Home Value in this Area
Purchase History
| Date | Buyer | Sale Price | Title Company |
|---|---|---|---|
| Ramesh Abilahs | $239,500 | None Available | |
| Haviland Erik J | $229,000 | Attorneys Title | |
| Bachmeier Alan J | $216,000 | Chicago Title Insurance Co |
Source: Public Records
Mortgage History
| Date | Status | Borrower | Loan Amount |
|---|---|---|---|
| Previous Owner | Haviland Erik J | $206,100 | |
| Previous Owner | Bachmeier Alan J | $21,594 | |
| Previous Owner | Bachmeier Alan J | $172,755 |
Source: Public Records
Tax History Compared to Growth
Tax History
| Year | Tax Paid | Tax Assessment Tax Assessment Total Assessment is a certain percentage of the fair market value that is determined by local assessors to be the total taxable value of land and additions on the property. | Land | Improvement |
|---|---|---|---|---|
| 2025 | $4,398 | $441,540 | $73,000 | $368,540 |
| 2024 | $4,398 | $441,540 | $73,000 | $368,540 |
| 2023 | $3,323 | $272,350 | $52,000 | $220,350 |
| 2022 | $3,313 | $271,590 | $52,000 | $219,590 |
| 2021 | $3,313 | $271,590 | $52,000 | $219,590 |
| 2020 | $3,313 | $271,590 | $52,000 | $219,590 |
| 2019 | $2,695 | $220,930 | $37,000 | $183,930 |
| 2018 | $2,651 | $220,930 | $37,000 | $183,930 |
| 2017 | $2,607 | $220,930 | $37,000 | $183,930 |
| 2016 | $1,547 | $202,740 | $27,000 | $175,740 |
| 2015 | $2,392 | $202,740 | $27,000 | $175,740 |
| 2014 | $2,392 | $202,740 | $27,000 | $175,740 |
Source: Public Records
Map
Nearby Homes
- 1930 Wilburn Park Ln NW
- 1960 Wilburn Park Ln NW
- 1523 Callender Ln
- 10056 Paisley Dr
- 9529 Numenore Dr
- 2055 Solway Ln
- 2111 Elendil Ln
- 2506 Susie Brumley Place NW
- 2013 Solway Ln
- 9516 Pacing Ln NW
- 10004 Legolas Ln
- 1458 Bedlington Dr NW
- 10015 Legolas Ln
- 10341 Montrose Dr NW
- 9509 Pacing Ln NW
- 1432 Bedlington Dr NW
- 2377 Maple Grove Ln NW
- 1309 Bedlington Dr NW
- 1243 Cox Mill Rd
- 2277 Elendil Ln
- 1929 Wilburn Park Ln NW
- 1921 Wilburn Park Ln NW
- 1933 Wilburn Park Ln NW
- 1917 Wilburn Park Ln NW
- 1926 Wilburn Park Ln NW
- 1922 Wilburn Park Ln NW
- 9723 Waltham Ct
- 1918 Wilburn Park Ln NW
- 9725 Waltham Ct
- 1913 Wilburn Park Ln NW
- 1937 Wilburn Park Ln NW
- 1914 Wilburn Park Ln NW
- 9719 Waltham Ct
- 1934 Wilburn Park Ln NW
- 9729 Waltham Ct
- 1909 Wilburn Park Ln NW
- 9721 Waltham Ct
- 1910 Wilburn Park Ln NW
- 1945 Wilburn Park Ln NW
- 1938 Wilburn Park Ln NW