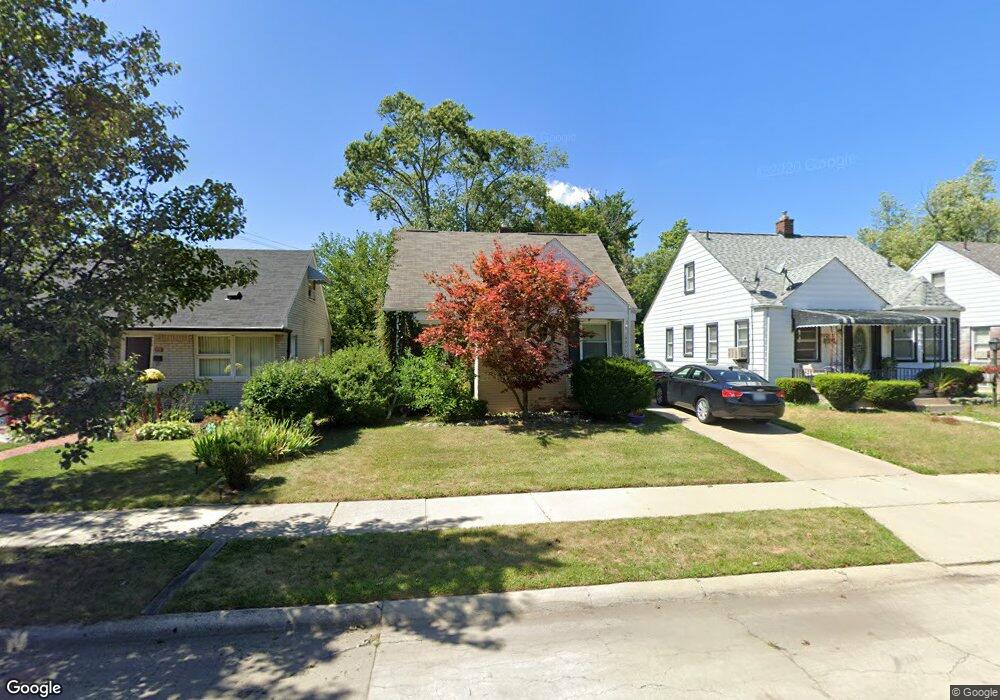
19255 Garfield Redford, MI 48240
Estimated Value: $131,000 - $159,000
3
Beds
1
Bath
1,019
Sq Ft
$146/Sq Ft
Est. Value
About This Home
This home is located at 19255 Garfield, Redford, MI 48240 and is currently estimated at $148,489, approximately $145 per square foot. 19255 Garfield is a home located in Wayne County with nearby schools including Beech Elementary School, Hilbert Middle School, and Redford Union High School.
Ownership History
Date
Name
Owned For
Owner Type
Purchase Details
Closed on
Jul 12, 2011
Sold by
Butcher David and Butcher Sally
Bought by
Marshall Tevin
Current Estimated Value
Home Financials for this Owner
Home Financials are based on the most recent Mortgage that was taken out on this home.
Original Mortgage
$36,062
Outstanding Balance
$25,089
Interest Rate
4.75%
Mortgage Type
FHA
Estimated Equity
$123,400
Purchase Details
Closed on
May 9, 2011
Sold by
Cook Frederick and Cook Frederick
Bought by
Butcher David
Purchase Details
Closed on
Sep 13, 2004
Sold by
Cook Frederick and Cook Betty
Bought by
Cook Frederick O
Purchase Details
Closed on
Oct 1, 2001
Sold by
Cook Betty
Bought by
Butcher David
Purchase Details
Closed on
Jul 28, 2000
Sold by
Charles Millard
Bought by
Frederick Cook
Purchase Details
Closed on
Jun 24, 1998
Sold by
Estate Of Pearl Smith
Bought by
Millard Charles
Create a Home Valuation Report for This Property
The Home Valuation Report is an in-depth analysis detailing your home's value as well as a comparison with similar homes in the area
Home Values in the Area
Average Home Value in this Area
Purchase History
| Date | Buyer | Sale Price | Title Company |
|---|---|---|---|
| Marshall Tevin | $37,000 | Stewart Title Guaranty Co | |
| Butcher David | -- | Stewart Title Agency | |
| Cook Frederick O | -- | -- | |
| Butcher David | $90,000 | -- | |
| Butcher David | $90,000 | None Available | |
| Frederick Cook | $45,000 | -- | |
| Millard Charles | -- | -- |
Source: Public Records
Mortgage History
| Date | Status | Borrower | Loan Amount |
|---|---|---|---|
| Open | Marshall Tevin | $36,062 |
Source: Public Records
Tax History Compared to Growth
Tax History
| Year | Tax Paid | Tax Assessment Tax Assessment Total Assessment is a certain percentage of the fair market value that is determined by local assessors to be the total taxable value of land and additions on the property. | Land | Improvement |
|---|---|---|---|---|
| 2025 | $727 | $71,800 | $0 | $0 |
| 2024 | $727 | $64,600 | $0 | $0 |
| 2023 | $693 | $54,100 | $0 | $0 |
| 2022 | $2,048 | $47,400 | $0 | $0 |
| 2021 | $1,701 | $44,800 | $0 | $0 |
| 2020 | $1,679 | $38,200 | $0 | $0 |
| 2019 | $1,643 | $29,000 | $0 | $0 |
| 2018 | $625 | $26,900 | $0 | $0 |
| 2017 | $1,838 | $26,400 | $0 | $0 |
| 2016 | $1,697 | $25,200 | $0 | $0 |
| 2015 | $2,245 | $23,500 | $0 | $0 |
| 2013 | $2,210 | $22,500 | $0 | $0 |
| 2012 | $1,583 | $26,800 | $6,200 | $20,600 |
Source: Public Records
Map
Nearby Homes
- 19341 Dalby
- 18850 Dalby
- 19550 Imperial Hwy
- 19498 Brady
- 19207 Grandview St
- 19551 Imperial Hwy
- 18711 Dalby
- 19401 Grandview St
- 18809 Sumner
- 19580 Brady
- 19599 Garfield
- 18810 Olympia
- 19610 Garfield
- 19371 Winston St
- 19495 Grandview St
- 19765 Sumner
- 18626 Five Points St
- 19336 Centralia
- 18508 Sumner
- 19919 Five Points St
- 19261 Garfield
- 19245 Garfield
- 19273 Garfield
- 25276 Grand River Ave
- 19287 Garfield
- 19254 Garfield
- 19220 Dalby Unit Bldg-Unit
- 19220 Dalby
- 19293 Garfield
- 19244 Garfield
- 19268 Garfield
- 19272 Garfield
- 19299 Garfield
- 19236 Dalby
- 19290 Garfield
- 19311 Garfield
- 19248 Dalby
- 19298 Garfield
- 19256 Dalby
- 19317 Garfield