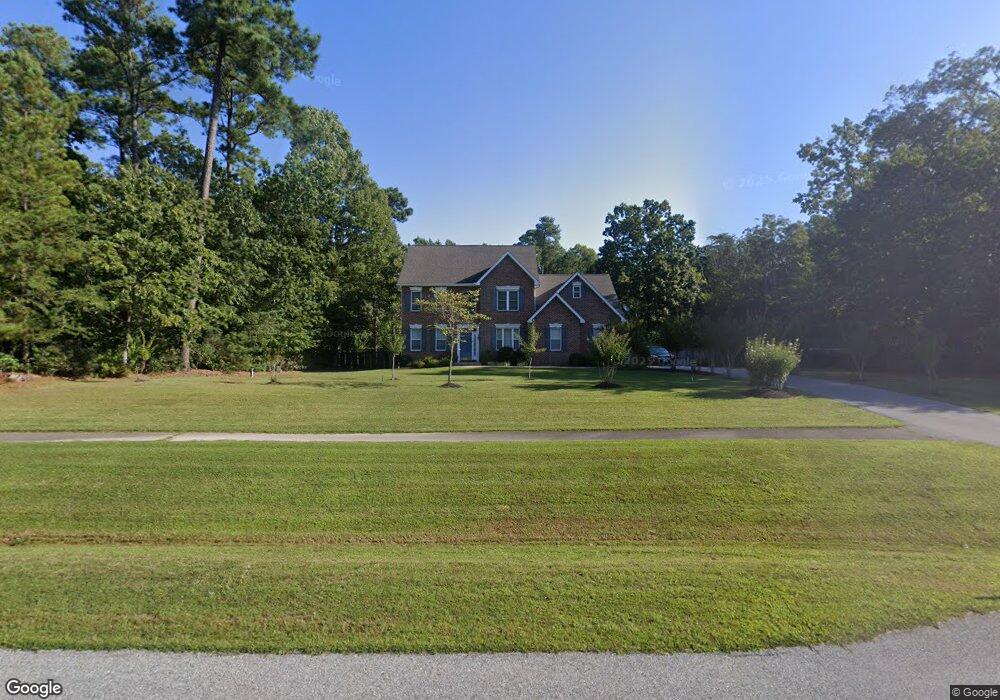
19256 King James Pkwy Lexington Park, MD 20653
Estimated Value: $527,000 - $587,000
--
Bed
3
Baths
2,732
Sq Ft
$204/Sq Ft
Est. Value
About This Home
This home is located at 19256 King James Pkwy, Lexington Park, MD 20653 and is currently estimated at $557,285, approximately $203 per square foot. 19256 King James Pkwy is a home located in St. Mary's County with nearby schools including Ridge Elementary School, Spring Ridge Middle School, and Great Mills High School.
Ownership History
Date
Name
Owned For
Owner Type
Purchase Details
Closed on
Feb 8, 2024
Sold by
Alvarez Jose T and Alvarez Armida
Bought by
Alvarez Armida
Current Estimated Value
Purchase Details
Closed on
Jun 26, 2007
Sold by
Dyer and Dyer Rew D
Bought by
Alvarez Jose T and Alvarez Armida
Home Financials for this Owner
Home Financials are based on the most recent Mortgage that was taken out on this home.
Original Mortgage
$404,100
Interest Rate
6.39%
Mortgage Type
Purchase Money Mortgage
Purchase Details
Closed on
Aug 26, 2003
Sold by
Orr Michael W
Bought by
Dyer Andrew D and Dyer Heather L
Purchase Details
Closed on
Feb 4, 2002
Sold by
Watt Christopher J
Bought by
Orr Michael W and Orr Jacqueline Kernon
Purchase Details
Closed on
Sep 8, 2000
Sold by
Carmichael Enterprises Inc
Bought by
Watt Christopher J and Watt Martha M
Create a Home Valuation Report for This Property
The Home Valuation Report is an in-depth analysis detailing your home's value as well as a comparison with similar homes in the area
Home Values in the Area
Average Home Value in this Area
Purchase History
| Date | Buyer | Sale Price | Title Company |
|---|---|---|---|
| Alvarez Armida | -- | None Listed On Document | |
| Alvarez Jose T | $449,000 | -- | |
| Dyer Andrew D | $299,000 | -- | |
| Orr Michael W | $272,000 | -- | |
| Watt Christopher J | $253,240 | -- |
Source: Public Records
Mortgage History
| Date | Status | Borrower | Loan Amount |
|---|---|---|---|
| Previous Owner | Alvarez Jose T | $404,100 | |
| Closed | Watt Christopher J | -- |
Source: Public Records
Tax History Compared to Growth
Tax History
| Year | Tax Paid | Tax Assessment Tax Assessment Total Assessment is a certain percentage of the fair market value that is determined by local assessors to be the total taxable value of land and additions on the property. | Land | Improvement |
|---|---|---|---|---|
| 2025 | $4,520 | $447,633 | $0 | $0 |
| 2024 | $4,374 | $419,267 | $0 | $0 |
| 2023 | $4,153 | $390,900 | $135,000 | $255,900 |
| 2022 | $4,034 | $378,633 | $0 | $0 |
| 2021 | $3,918 | $366,367 | $0 | $0 |
| 2020 | $3,805 | $354,100 | $130,000 | $224,100 |
| 2019 | $3,803 | $354,100 | $130,000 | $224,100 |
| 2018 | $3,801 | $354,100 | $130,000 | $224,100 |
| 2017 | $3,815 | $357,300 | $0 | $0 |
| 2016 | $4,300 | $349,733 | $0 | $0 |
| 2015 | $4,300 | $342,167 | $0 | $0 |
| 2014 | $4,300 | $334,600 | $0 | $0 |
Source: Public Records
Map
Nearby Homes
- 48695 Saint James Church Rd
- 19717 Oak Ct
- 48560 Evergreen Park Rd
- 19791 Sams Way
- Lot 8 Section C Spring Lake Dr
- 48850 Evergreen Park Rd
- 18457 Heritage Ct
- 18394 Chestnut St
- 18448 Three Notch Rd
- 18390 Matthews Dr
- 48493 Heritage Hill Ln
- 18324 Chestnut St
- 0 Snowhill Way
- 18368 Hartman Dr
- 18348 Bauer Rd
- 18145 Point Lookout Rd
- 18500 Shipwreck Way
- 18048 Trossbach Rd
- 47748 Sunset Manor Ln
- 17881 Three Notch Rd
- 19280 Cornwallis Ct
- 19250 King James Pkwy
- 19255 King James Pkwy
- 19286 Cornwallis Ct
- 19277 Cornwallis Ct
- 19244 King James Pkwy
- 19241 King James Pkwy
- 19292 Cornwallis Ct
- 19287 Cornwallis Ct
- 19238 King James Pkwy
- 19298 Cornwallis Ct
- 19291 Cornwallis Ct
- 48610 King James Rd
- 19299 Cornwallis Ct
- 19271 King James Pkwy
- 48579 Mattapany Rd
- 19266 King James Pkwy
- 19221 King James Pkwy
- 48400 Princess Ct
- 19224 S King James Pkwy