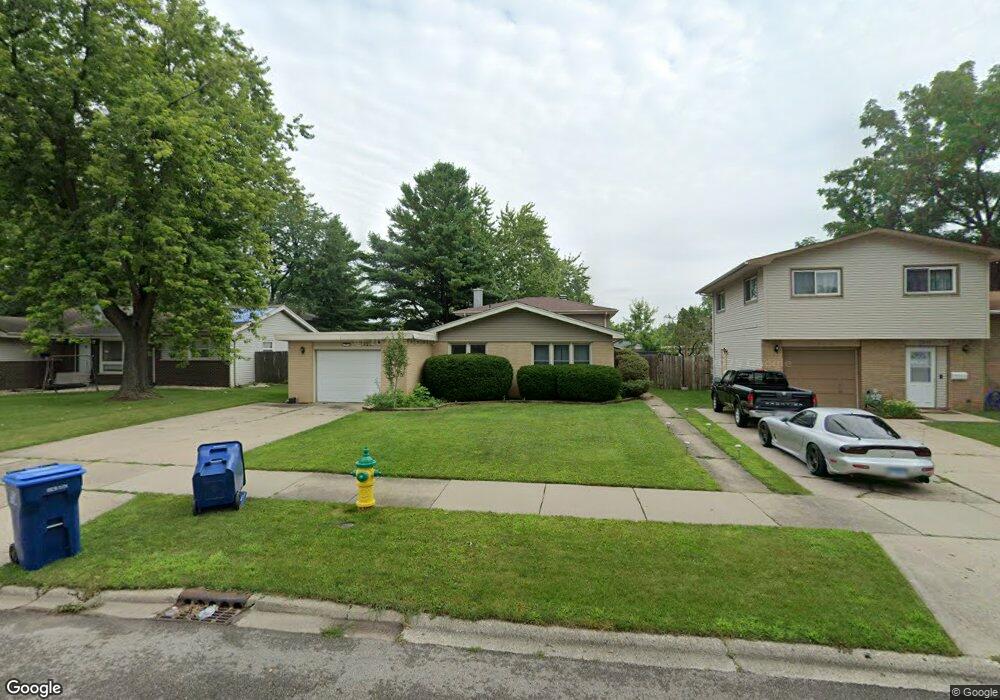
1926 Arthur Dr Waukegan, IL 60087
Estimated Value: $265,000 - $297,000
3
Beds
2
Baths
1,396
Sq Ft
$200/Sq Ft
Est. Value
About This Home
This home is located at 1926 Arthur Dr, Waukegan, IL 60087 and is currently estimated at $279,785, approximately $200 per square foot. 1926 Arthur Dr is a home located in Lake County with nearby schools including H R McCall Elementary School, Jack Benny Middle School, and Waukegan High School.
Ownership History
Date
Name
Owned For
Owner Type
Purchase Details
Closed on
Oct 30, 2017
Sold by
Lobue David
Bought by
Montes Ricardo and Ruiz Ofelia
Current Estimated Value
Home Financials for this Owner
Home Financials are based on the most recent Mortgage that was taken out on this home.
Original Mortgage
$137,365
Outstanding Balance
$116,216
Interest Rate
4.4%
Mortgage Type
FHA
Estimated Equity
$163,569
Purchase Details
Closed on
Jun 22, 2017
Sold by
Moncivaiz
Bought by
Lobue David
Purchase Details
Closed on
Jun 16, 2010
Sold by
Greer Billy B and Billy B Greer Iii Trust
Bought by
Moncivaiz Michel
Home Financials for this Owner
Home Financials are based on the most recent Mortgage that was taken out on this home.
Original Mortgage
$5,000
Interest Rate
4.74%
Mortgage Type
Stand Alone Second
Purchase Details
Closed on
Nov 15, 2005
Sold by
Greer Billy B
Bought by
Greer Billy B and The Billy B Greer Iii Trust
Create a Home Valuation Report for This Property
The Home Valuation Report is an in-depth analysis detailing your home's value as well as a comparison with similar homes in the area
Home Values in the Area
Average Home Value in this Area
Purchase History
| Date | Buyer | Sale Price | Title Company |
|---|---|---|---|
| Montes Ricardo | $140,000 | Attorneys Title Guaranty Fun | |
| Lobue David | $90,000 | None Available | |
| Moncivaiz Michel | $140,000 | Ticor | |
| Greer Billy B | -- | None Available |
Source: Public Records
Mortgage History
| Date | Status | Borrower | Loan Amount |
|---|---|---|---|
| Open | Montes Ricardo | $137,365 | |
| Previous Owner | Moncivaiz Michel | $5,000 | |
| Previous Owner | Moncivaiz Michel | $134,561 |
Source: Public Records
Tax History Compared to Growth
Tax History
| Year | Tax Paid | Tax Assessment Tax Assessment Total Assessment is a certain percentage of the fair market value that is determined by local assessors to be the total taxable value of land and additions on the property. | Land | Improvement |
|---|---|---|---|---|
| 2024 | $6,103 | $76,107 | $6,116 | $69,991 |
| 2023 | $5,933 | $73,469 | $5,904 | $67,565 |
| 2022 | $5,933 | $67,421 | $5,769 | $61,652 |
| 2021 | $5,072 | $55,278 | $5,622 | $49,656 |
| 2020 | $5,227 | $52,751 | $5,365 | $47,386 |
| 2019 | $5,418 | $50,048 | $5,090 | $44,958 |
| 2018 | $4,786 | $42,671 | $6,067 | $36,604 |
| 2017 | $4,778 | $40,142 | $5,707 | $34,435 |
| 2016 | $4,890 | $38,216 | $5,433 | $32,783 |
| 2015 | $4,815 | $35,048 | $4,983 | $30,065 |
| 2014 | $5,696 | $41,592 | $9,134 | $32,458 |
| 2012 | $6,564 | $43,222 | $9,492 | $33,730 |
Source: Public Records
Map
Nearby Homes
- 3411 N Lewis Ave
- 37966 N Cornell Rd
- 3211 Rugby Ct
- 1730 W Beach Rd
- 38683 N Lewis Ave
- 38127 N Shore Ave
- 38362 N Manor Ave
- 3101 Country Club Ln
- 1636 Rice St
- 38697 N Cedar Ave
- 37905 N Loyola Ave
- 11345 W Carnahan Ave
- 11342-11364 W Wadsworth Rd
- 1612 Whitney St
- 12582 W Beach Rd
- 2613 N Lewis Ave
- 12312 W Audrey Ave
- 38859 N Green Bay Rd
- 12640 W Wadsworth Rd
- 39113 N Green Bay Rd
- 1930 Arthur Dr
- 1922 Arthur Dr
- 1925 Irving Pkwy Unit 1
- 2000 Arthur Dr
- 1918 Arthur Dr
- 1929 Irving Pkwy
- 1921 Irving Pkwy
- 2001 Irving Pkwy
- 1927 Arthur Dr
- 1917 Irving Pkwy
- 2004 Arthur Dr
- 1931 Arthur Dr
- 1923 Arthur Dr
- 2005 Irving Pkwy
- 1919 Arthur Dr
- 1913 Irving Pkwy
- 2008 Arthur Dr
- 3500 Stonegate Rd
- 2005 Arthur Dr
- 1915 Arthur Dr