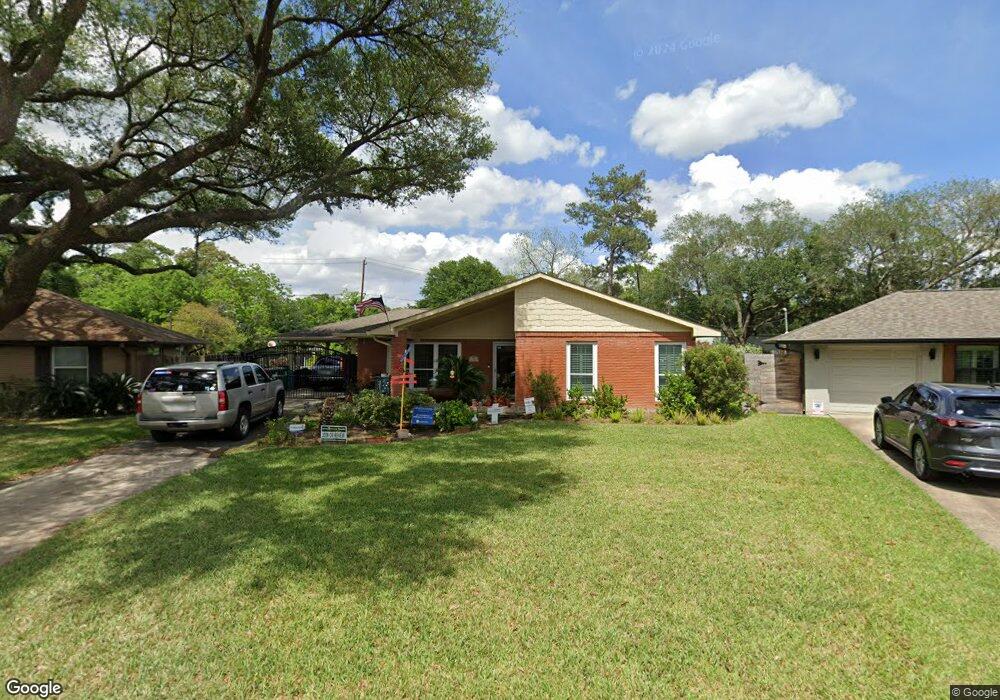
1926 Brimberry St Houston, TX 77018
Oak Forest-Garden Oaks NeighborhoodEstimated Value: $516,000 - $819,077
4
Beds
2
Baths
2,524
Sq Ft
$287/Sq Ft
Est. Value
About This Home
This home is located at 1926 Brimberry St, Houston, TX 77018 and is currently estimated at $724,769, approximately $287 per square foot. 1926 Brimberry St is a home located in Harris County with nearby schools including Stevens Elementary School, Frank Black Middle School, and Waltrip High School.
Ownership History
Date
Name
Owned For
Owner Type
Purchase Details
Closed on
Feb 21, 2020
Sold by
Cain Lucy F and Fisher Lucy F
Bought by
Cain Gregory L and Cain Lucy F
Current Estimated Value
Home Financials for this Owner
Home Financials are based on the most recent Mortgage that was taken out on this home.
Original Mortgage
$260,000
Outstanding Balance
$230,212
Interest Rate
3.6%
Mortgage Type
New Conventional
Estimated Equity
$494,557
Purchase Details
Closed on
Jun 27, 2001
Sold by
Spears Terry L
Bought by
Fisher Lucy F
Home Financials for this Owner
Home Financials are based on the most recent Mortgage that was taken out on this home.
Original Mortgage
$117,029
Interest Rate
7.11%
Mortgage Type
FHA
Purchase Details
Closed on
Mar 30, 1995
Sold by
Hoovestol Paeder T and Mooney Anne M
Bought by
Spears Terry L
Home Financials for this Owner
Home Financials are based on the most recent Mortgage that was taken out on this home.
Original Mortgage
$75,650
Interest Rate
8.72%
Create a Home Valuation Report for This Property
The Home Valuation Report is an in-depth analysis detailing your home's value as well as a comparison with similar homes in the area
Home Values in the Area
Average Home Value in this Area
Purchase History
| Date | Buyer | Sale Price | Title Company |
|---|---|---|---|
| Cain Gregory L | -- | None Available | |
| Fisher Lucy F | -- | Commerce Land Title | |
| Spears Terry L | -- | Heritage Title Company |
Source: Public Records
Mortgage History
| Date | Status | Borrower | Loan Amount |
|---|---|---|---|
| Open | Cain Gregory L | $260,000 | |
| Closed | Fisher Lucy F | $117,029 | |
| Previous Owner | Spears Terry L | $75,650 |
Source: Public Records
Tax History Compared to Growth
Tax History
| Year | Tax Paid | Tax Assessment Tax Assessment Total Assessment is a certain percentage of the fair market value that is determined by local assessors to be the total taxable value of land and additions on the property. | Land | Improvement |
|---|---|---|---|---|
| 2025 | $6,575 | $810,000 | $543,616 | $266,384 |
| 2024 | $6,575 | $785,354 | $512,253 | $273,101 |
| 2023 | $6,575 | $758,651 | $512,253 | $246,398 |
| 2022 | $13,415 | $609,258 | $449,528 | $159,730 |
| 2021 | $13,192 | $566,000 | $386,804 | $179,196 |
| 2020 | $13,021 | $537,697 | $386,804 | $150,893 |
| 2019 | $14,301 | $565,158 | $386,804 | $178,354 |
| 2018 | $8,630 | $550,090 | $365,895 | $184,195 |
| 2017 | $13,909 | $550,090 | $365,895 | $184,195 |
| 2016 | $14,337 | $567,000 | $365,895 | $201,105 |
| 2015 | $4,937 | $534,544 | $313,625 | $220,919 |
| 2014 | $4,937 | $333,566 | $261,354 | $72,212 |
Source: Public Records
Map
Nearby Homes
- 1850 Viking Dr
- 1818 Nina Lee Ln
- 2023 Viking Dr
- 2103 Brimberry St
- 4403 Sumner Dr
- 2106 Nina Lee Ln
- 4414 Belle Glade Dr
- 1720 Libbey Dr
- 4415 Donna Bell Ln
- 1730 Hewitt Dr
- 4414 Lavell Dr
- 2111 Nina Lee Ln
- 2007 Hewitt Dr
- 1706 Hewitt Dr
- 4415 Fallbrook Dr
- 2218 Libbey Dr
- 4411 Deer Lodge Dr
- 1642 Viking Dr
- 2107 Hewitt Dr
- 1634 Latexo Dr
- 1922 Brimberry St
- 1930 Brimberry St
- 1911 De Milo Dr
- 1915 De Milo Dr
- 1907 De Milo Dr
- 1918 Brimberry St
- 1934 Brimberry St
- 1903 De Milo Dr
- 1919 Brimberry St
- 1923 De Milo Dr
- 1914 Brimberry St
- 1938 Brimberry St
- 1835 De Milo Dr
- 1915 Brimberry St
- 1831 De Milo Dr
- 1910 Brimberry St
- 1942 Brimberry St
- 4318 Donna Bell Ln
- 1931 De Milo Dr
- 1910 De Milo Dr