Estimated Value: $748,949 - $849,000
3
Beds
3
Baths
2,358
Sq Ft
$342/Sq Ft
Est. Value
About This Home
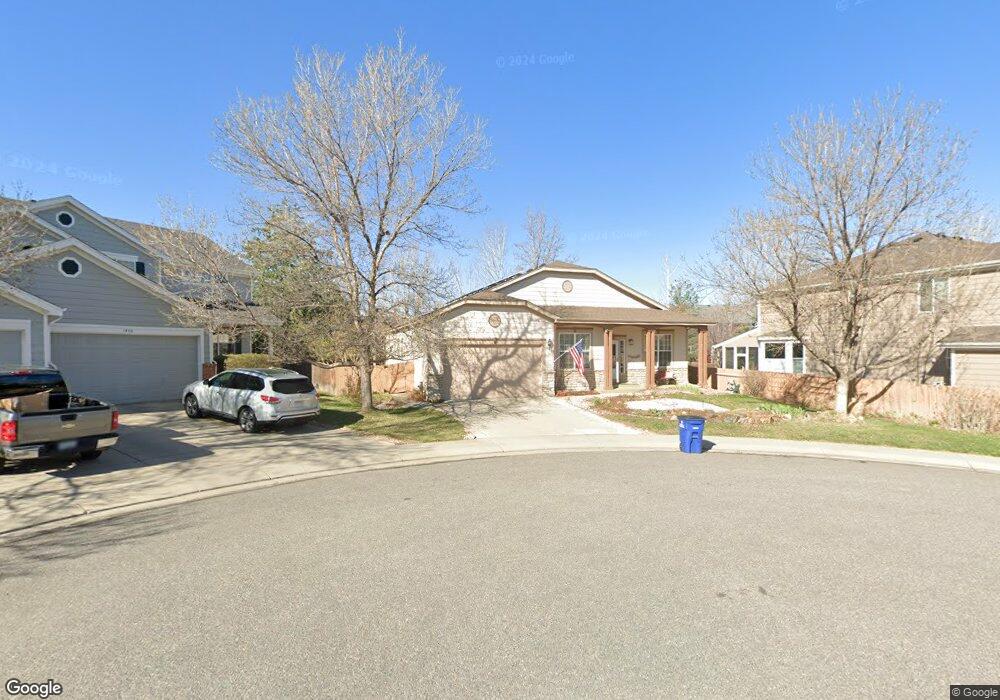
This home is located at 1926 Larson Ct, Erie, CO 80516 and is currently estimated at $807,237, approximately $342 per square foot. 1926 Larson Ct is a home located in Boulder County with nearby schools including Meadowlark School, Centaurus High School, and Peak to Peak Charter School.
Ownership History
Date
Name
Owned For
Owner Type
Purchase Details
Closed on
Aug 12, 2024
Sold by
Frith Clifford F and Frith Jeanne W
Bought by
David B Frith And Auben L S Frith Trust and Frith
Current Estimated Value
Purchase Details
Closed on
Jun 16, 2005
Sold by
Crain Teri L and Crain Brent Teri
Bought by
Frith Clifford F and Frith Jeanne W
Home Financials for this Owner
Home Financials are based on the most recent Mortgage that was taken out on this home.
Original Mortgage
$200,000
Interest Rate
5.78%
Mortgage Type
Stand Alone First
Purchase Details
Closed on
Oct 30, 1998
Sold by
Kdb Homes Inc
Bought by
Brent Teri L
Home Financials for this Owner
Home Financials are based on the most recent Mortgage that was taken out on this home.
Original Mortgage
$161,400
Interest Rate
6.57%
Create a Home Valuation Report for This Property
The Home Valuation Report is an in-depth analysis detailing your home's value as well as a comparison with similar homes in the area
Home Values in the Area
Average Home Value in this Area
Purchase History
| Date | Buyer | Sale Price | Title Company |
|---|---|---|---|
| David B Frith And Auben L S Frith Trust | -- | None Listed On Document | |
| Frith Clifford F | $335,000 | First Colorado Title | |
| Brent Teri L | $215,233 | -- |
Source: Public Records
Mortgage History
| Date | Status | Borrower | Loan Amount |
|---|---|---|---|
| Previous Owner | Frith Clifford F | $200,000 | |
| Previous Owner | Brent Teri L | $161,400 |
Source: Public Records
Tax History Compared to Growth
Tax History
| Year | Tax Paid | Tax Assessment Tax Assessment Total Assessment is a certain percentage of the fair market value that is determined by local assessors to be the total taxable value of land and additions on the property. | Land | Improvement |
|---|---|---|---|---|
| 2025 | $4,194 | $44,738 | $11,925 | $32,813 |
| 2024 | $4,194 | $44,738 | $11,925 | $32,813 |
| 2023 | $4,921 | $46,438 | $16,194 | $33,929 |
| 2022 | $4,157 | $36,883 | $10,244 | $26,639 |
| 2021 | $4,148 | $37,945 | $10,539 | $27,406 |
| 2020 | $3,950 | $35,664 | $6,578 | $29,086 |
| 2019 | $3,893 | $35,664 | $6,578 | $29,086 |
| 2018 | $3,612 | $32,630 | $9,288 | $23,342 |
| 2017 | $3,447 | $36,074 | $10,268 | $25,806 |
| 2016 | $3,312 | $31,323 | $13,214 | $18,109 |
| 2015 | $4,011 | $25,401 | $7,642 | $17,759 |
| 2014 | $3,466 | $25,401 | $7,642 | $17,759 |
Source: Public Records
Map
Nearby Homes
- 1817 Powell St
- 1842 Southard St
- 1009 Acadia Ave
- 2133 Fountain Cir
- 1426 Lyons Ln
- 849 Furrow Way
- 304 W Beacon Hill Dr
- 921 Latigo Loop
- 917 Latigo Loop
- 1195 Fox Hills Ct
- 1481 Loraine Cir N
- 1481 Loraine Cir N
- 1451 Loraine Cir N
- 1441 Loraine Cir N
- 1441 Loraine Cir N
- 1431 Loraine Cir N
- 1400 Loraine Cir N
- 1471 Loraine Cir N
- 1410 Loraine Cir N
- 1430 Loraine Cir N