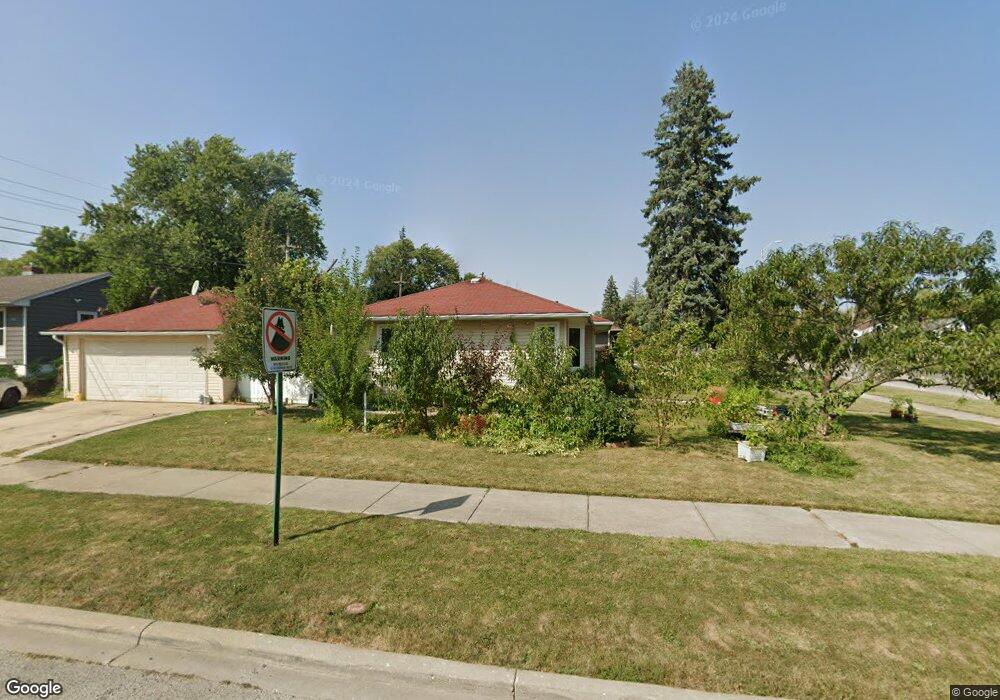
1926 N Mcaree Rd Waukegan, IL 60087
Lake Cogardens NeighborhoodEstimated Value: $212,000 - $240,000
3
Beds
1
Bath
905
Sq Ft
$250/Sq Ft
Est. Value
About This Home
This home is located at 1926 N Mcaree Rd, Waukegan, IL 60087 and is currently estimated at $226,185, approximately $249 per square foot. 1926 N Mcaree Rd is a home located in Lake County with nearby schools including Clearview Elementary School, Miguel Juarez Middle School, and Waukegan High School.
Ownership History
Date
Name
Owned For
Owner Type
Purchase Details
Closed on
Oct 10, 2025
Sold by
Alvarez Jenny R and Acosta Jenny Rosario
Bought by
Alvarez Jenny Rosario
Current Estimated Value
Purchase Details
Closed on
May 7, 2009
Sold by
Ulloa Jenny and Acosta Jenny R
Bought by
Acosta Jenny R
Home Financials for this Owner
Home Financials are based on the most recent Mortgage that was taken out on this home.
Original Mortgage
$128,058
Interest Rate
4.83%
Mortgage Type
FHA
Purchase Details
Closed on
Jun 14, 2004
Sold by
Vicario Gloria
Bought by
Ullca Jenny
Home Financials for this Owner
Home Financials are based on the most recent Mortgage that was taken out on this home.
Original Mortgage
$127,382
Interest Rate
6.37%
Mortgage Type
FHA
Purchase Details
Closed on
Apr 18, 2000
Sold by
Bueno Onofre and Bueno Monina
Bought by
Vicario Gloria
Home Financials for this Owner
Home Financials are based on the most recent Mortgage that was taken out on this home.
Original Mortgage
$91,906
Interest Rate
8.29%
Mortgage Type
FHA
Create a Home Valuation Report for This Property
The Home Valuation Report is an in-depth analysis detailing your home's value as well as a comparison with similar homes in the area
Home Values in the Area
Average Home Value in this Area
Purchase History
| Date | Buyer | Sale Price | Title Company |
|---|---|---|---|
| Alvarez Jenny Rosario | -- | None Listed On Document | |
| Acosta Jenny R | -- | Greater Illinois Title Co | |
| Ullca Jenny | $135,500 | Chicago Title Insurance Comp | |
| Vicario Gloria | $92,500 | -- |
Source: Public Records
Mortgage History
| Date | Status | Borrower | Loan Amount |
|---|---|---|---|
| Previous Owner | Acosta Jenny R | $128,058 | |
| Previous Owner | Ullca Jenny | $127,382 | |
| Previous Owner | Vicario Gloria | $91,906 |
Source: Public Records
Tax History Compared to Growth
Tax History
| Year | Tax Paid | Tax Assessment Tax Assessment Total Assessment is a certain percentage of the fair market value that is determined by local assessors to be the total taxable value of land and additions on the property. | Land | Improvement |
|---|---|---|---|---|
| 2024 | $3,893 | $54,647 | $8,128 | $46,519 |
| 2023 | $3,287 | $49,283 | $7,330 | $41,953 |
| 2022 | $3,287 | $39,627 | $6,908 | $32,719 |
| 2021 | $3,514 | $39,702 | $6,892 | $32,810 |
| 2020 | $3,513 | $36,987 | $6,421 | $30,566 |
| 2019 | $3,483 | $33,893 | $5,884 | $28,009 |
| 2018 | $2,908 | $28,869 | $6,664 | $22,205 |
| 2017 | $2,780 | $25,541 | $5,896 | $19,645 |
| 2016 | $2,503 | $22,194 | $5,123 | $17,071 |
| 2015 | $2,342 | $19,864 | $4,585 | $15,279 |
| 2014 | $2,623 | $21,044 | $5,111 | $15,933 |
| 2012 | $3,471 | $22,800 | $5,538 | $17,262 |
Source: Public Records
Map
Nearby Homes
- 2440 W Cheyenne Rd
- 1913 Chippewa Rd
- 2715 W Greenwood Ave
- 2207 Williamsburg Dr
- 2928 W Country Club Ave
- 3000 W Country Club Ave
- 2946 W Country Club Ave
- 2810 W Atlantic Ave
- 2713 Varonen Ave
- 12352 W Atlantic Ave
- 2008 Harding Ave
- 3320 Sunset Ave
- 2705 Dana Ave
- 2009 Harding Ave
- 2708 Dana Ave
- 2813 Theresa Ave
- 2350 N Lewis Ave
- 3032 W Vermont Ave
- 36955 N Garrick Ave
- 12933 W Polo Ave
- 1930 N Mcaree Rd
- 2608 W Florida Ave
- 1918 N Mcaree Rd
- 2000 N Mcaree Rd
- 2612 W Florida Ave
- 2609 W Florida Ave
- 1939 N Mcaree Rd
- 1933 N Mcaree Rd
- 1914 N Mcaree Rd
- 1945 N Mcaree Rd
- 2616 W Florida Ave
- 2008 N Mcaree Rd Unit 2
- 1927 N Mcaree Rd
- 2613 W Florida Ave
- 2001 N Mcaree Rd
- 1921 N Mcaree Rd
- 2617 Illini Rd
- 2621 Illini Rd
- 2617 W Florida Ave
- 1910 N Mcaree Rd