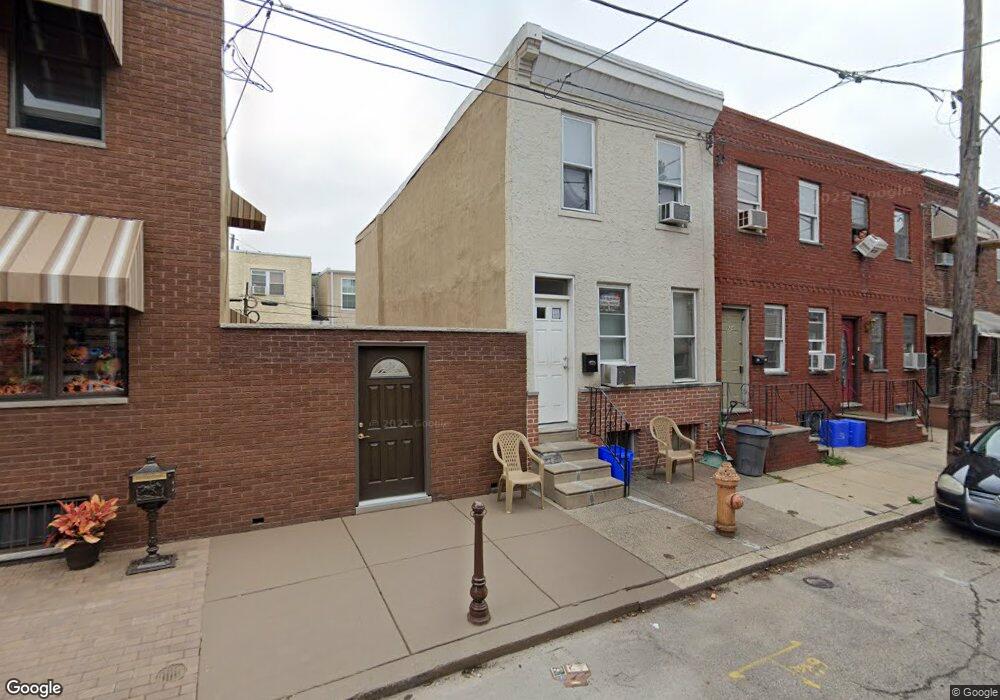
1926 S Jessup St Philadelphia, PA 19148
East Passyunk NeighborhoodEstimated Value: $317,800 - $451,000
2
Beds
1
Bath
1,064
Sq Ft
$353/Sq Ft
Est. Value
About This Home
This home is located at 1926 S Jessup St, Philadelphia, PA 19148 and is currently estimated at $375,700, approximately $353 per square foot. 1926 S Jessup St is a home located in Philadelphia County with nearby schools including South Philadelphia High School, Southwark School, and Our Lady of Hope.
Ownership History
Date
Name
Owned For
Owner Type
Purchase Details
Closed on
Jan 20, 2011
Sold by
Massi Anthony H
Bought by
Reimer John and Reimer Rosemary
Current Estimated Value
Purchase Details
Closed on
Sep 26, 2008
Sold by
Lepore Erik and Lepore Thomas
Bought by
Massi Anthony H
Purchase Details
Closed on
May 22, 2003
Sold by
Stranix Bruce and Stranix Linda
Bought by
Lepore Erik and Lepore Thomas
Home Financials for this Owner
Home Financials are based on the most recent Mortgage that was taken out on this home.
Original Mortgage
$58,500
Interest Rate
5.86%
Mortgage Type
Purchase Money Mortgage
Purchase Details
Closed on
Feb 23, 2001
Sold by
Vanore Daniel A and Vanore Denise L
Bought by
Stranix Bruce and Stranix Linda
Home Financials for this Owner
Home Financials are based on the most recent Mortgage that was taken out on this home.
Original Mortgage
$25,000
Interest Rate
7%
Create a Home Valuation Report for This Property
The Home Valuation Report is an in-depth analysis detailing your home's value as well as a comparison with similar homes in the area
Home Values in the Area
Average Home Value in this Area
Purchase History
| Date | Buyer | Sale Price | Title Company |
|---|---|---|---|
| Reimer John | $50,000 | None Available | |
| Massi Anthony H | $75,000 | None Available | |
| Lepore Erik | $65,000 | Security Search & Abstract C | |
| Stranix Bruce | $40,000 | -- |
Source: Public Records
Mortgage History
| Date | Status | Borrower | Loan Amount |
|---|---|---|---|
| Previous Owner | Lepore Erik | $58,500 | |
| Previous Owner | Stranix Bruce | $25,000 |
Source: Public Records
Tax History Compared to Growth
Tax History
| Year | Tax Paid | Tax Assessment Tax Assessment Total Assessment is a certain percentage of the fair market value that is determined by local assessors to be the total taxable value of land and additions on the property. | Land | Improvement |
|---|---|---|---|---|
| 2025 | $3,779 | $296,400 | $59,280 | $237,120 |
| 2024 | $3,779 | $296,400 | $59,280 | $237,120 |
| 2023 | $3,779 | $270,000 | $54,000 | $216,000 |
| 2022 | $3,628 | $270,000 | $54,000 | $216,000 |
| 2021 | $3,628 | $0 | $0 | $0 |
| 2020 | $3,628 | $0 | $0 | $0 |
| 2019 | $3,348 | $0 | $0 | $0 |
| 2018 | $2,567 | $0 | $0 | $0 |
| 2017 | $2,567 | $0 | $0 | $0 |
| 2016 | $2,533 | $0 | $0 | $0 |
| 2015 | $2,246 | $0 | $0 | $0 |
| 2014 | -- | $167,600 | $12,369 | $155,231 |
| 2012 | -- | $9,504 | $1,128 | $8,376 |
Source: Public Records
Map
Nearby Homes
- 1927 S 12th St
- 1936 S Sartain St
- 1912 S Sartain St
- 1218 Mckean St
- 1120 Emily St
- 1229 Emily St
- 1133 Mercy St
- 1154 Mercy St
- 1034 Mckean St
- 1105 Snyder Ave
- 1204 Moore St
- 1307 Mifflin St
- 1031 Mercy St
- 1037 Snyder Ave
- 1006 Mckean St
- 1234 Snyder Ave
- 1116 Cantrell St
- 1921 S 10th St
- 1133 Winton St
- 1106 Cantrell St
- 1924 S Jessup St
- 1922 S Jessup St
- 1930 S Jessup St
- 1932 S Jessup St
- 1920 S Jessup St
- 1923 S Sartain St
- 1918 S Jessup St
- 1934 S Jessup St
- 1925 S Sartain St
- 1927 S Sartain St
- 1929 S Sartain St
- 1921 S Sartain St
- 1919 S Sartain St
- 1916 S Jessup St
- 1931 S Sartain St
- 1936 S Jessup St
- 1927 S Jessup St
- 1917 S Sartain St
- 1923 S Jessup St
- 1933 S Sartain St