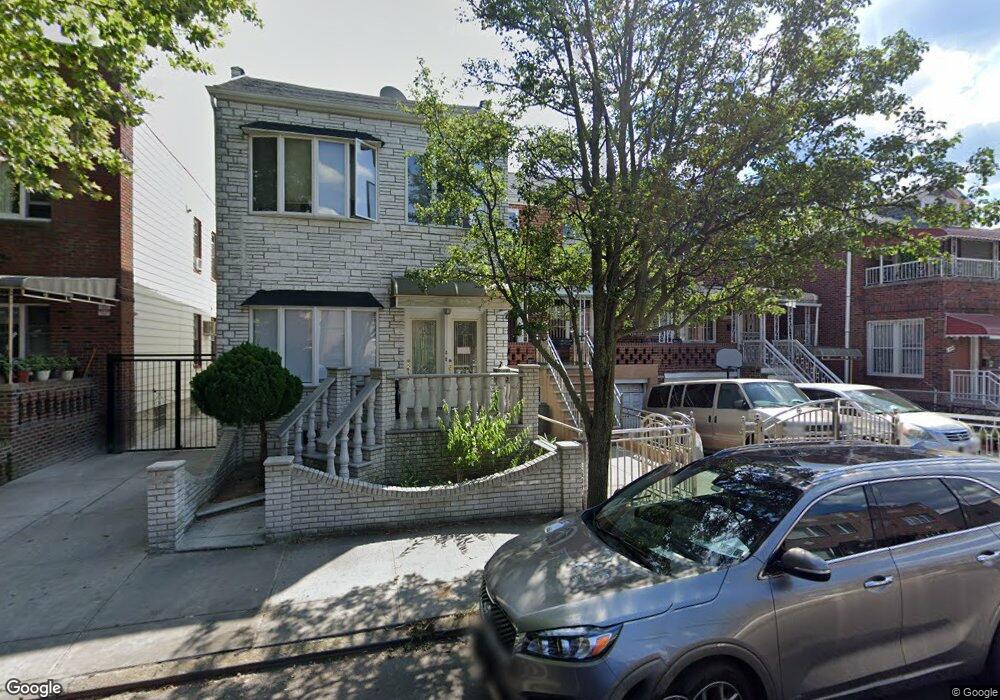
1928 73rd St Brooklyn, NY 11204
Bensonhurst NeighborhoodEstimated Value: $1,686,000 - $1,924,000
--
Bed
--
Bath
2,766
Sq Ft
$646/Sq Ft
Est. Value
About This Home
This home is located at 1928 73rd St, Brooklyn, NY 11204 and is currently estimated at $1,786,687, approximately $645 per square foot. 1928 73rd St is a home located in Kings County with nearby schools including P.S. 186 Dr. Irving A. Gladstone Elementary School, Seth Low Intermediate School 96, and New Utrecht High School.
Ownership History
Date
Name
Owned For
Owner Type
Purchase Details
Closed on
Sep 12, 2006
Sold by
Chan Mei Wah Wong and Chan Sing Man
Bought by
Xique Evelio
Current Estimated Value
Home Financials for this Owner
Home Financials are based on the most recent Mortgage that was taken out on this home.
Original Mortgage
$640,800
Interest Rate
6.52%
Mortgage Type
Purchase Money Mortgage
Purchase Details
Closed on
Oct 22, 1999
Sold by
Chan Hok Yu
Bought by
Chan Sing Man and Chan Mei Wah Wong
Create a Home Valuation Report for This Property
The Home Valuation Report is an in-depth analysis detailing your home's value as well as a comparison with similar homes in the area
Home Values in the Area
Average Home Value in this Area
Purchase History
| Date | Buyer | Sale Price | Title Company |
|---|---|---|---|
| Xique Evelio | $801,000 | -- | |
| Xique Evelio | $801,000 | -- | |
| Chan Sing Man | -- | -- | |
| Chan Sing Man | -- | -- |
Source: Public Records
Mortgage History
| Date | Status | Borrower | Loan Amount |
|---|---|---|---|
| Previous Owner | Xique Evelio | $640,800 |
Source: Public Records
Tax History Compared to Growth
Tax History
| Year | Tax Paid | Tax Assessment Tax Assessment Total Assessment is a certain percentage of the fair market value that is determined by local assessors to be the total taxable value of land and additions on the property. | Land | Improvement |
|---|---|---|---|---|
| 2025 | $11,442 | $96,720 | $14,640 | $82,080 |
| 2024 | $11,442 | $99,900 | $14,640 | $85,260 |
| 2023 | $10,915 | $100,620 | $14,640 | $85,980 |
| 2022 | $10,292 | $85,440 | $14,640 | $70,800 |
| 2021 | $10,557 | $87,780 | $14,640 | $73,140 |
| 2020 | $5,248 | $95,460 | $14,640 | $80,820 |
| 2019 | $9,931 | $83,640 | $14,640 | $69,000 |
| 2018 | $9,130 | $44,788 | $8,936 | $35,852 |
| 2017 | $8,758 | $42,963 | $8,543 | $34,420 |
| 2016 | $8,357 | $41,803 | $10,570 | $31,233 |
| 2015 | $4,669 | $41,803 | $15,844 | $25,959 |
| 2014 | $4,669 | $39,563 | $13,253 | $26,310 |
Source: Public Records
Map
Nearby Homes