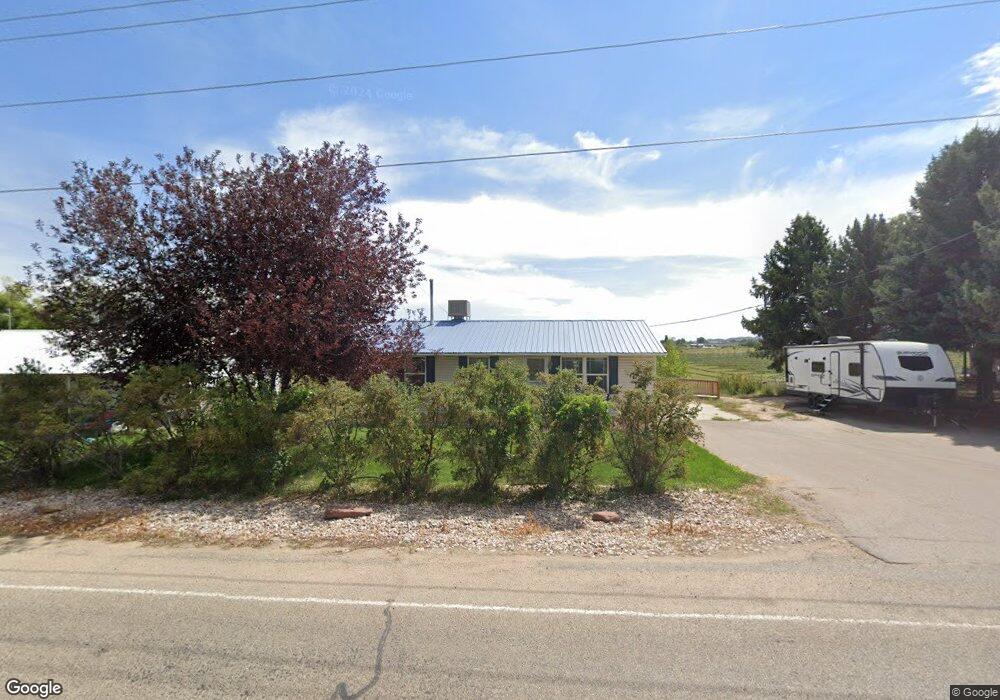
1928 E 3500 S Vernal, UT 84078
Estimated Value: $273,000 - $356,000
5
Beds
2
Baths
2,000
Sq Ft
$160/Sq Ft
Est. Value
About This Home
This home is located at 1928 E 3500 S, Vernal, UT 84078 and is currently estimated at $320,658, approximately $160 per square foot. 1928 E 3500 S is a home located in Uintah County with nearby schools including Davis School, Vernal Middle School, and Uintah Middle School.
Ownership History
Date
Name
Owned For
Owner Type
Purchase Details
Closed on
Aug 7, 2009
Sold by
Murray Floyd P and Murray Rita A
Bought by
Merrick Reed A and Merrick Rachael L
Current Estimated Value
Home Financials for this Owner
Home Financials are based on the most recent Mortgage that was taken out on this home.
Original Mortgage
$5,946
Outstanding Balance
$3,908
Interest Rate
5.37%
Mortgage Type
Stand Alone Second
Estimated Equity
$316,750
Purchase Details
Closed on
Jun 2, 2006
Sold by
Reynolds Danny J and Reynolds Jeanine
Bought by
Murray Floyd P and Murray Rita A
Home Financials for this Owner
Home Financials are based on the most recent Mortgage that was taken out on this home.
Original Mortgage
$33,600
Interest Rate
6.17%
Mortgage Type
Stand Alone Second
Purchase Details
Closed on
May 27, 2005
Sold by
Smith Robert L and Smith Kelleen B
Bought by
Reynolds Danny J and Reynolds Jeanine
Home Financials for this Owner
Home Financials are based on the most recent Mortgage that was taken out on this home.
Original Mortgage
$121,591
Interest Rate
5.84%
Mortgage Type
FHA
Create a Home Valuation Report for This Property
The Home Valuation Report is an in-depth analysis detailing your home's value as well as a comparison with similar homes in the area
Home Values in the Area
Average Home Value in this Area
Purchase History
| Date | Buyer | Sale Price | Title Company |
|---|---|---|---|
| Merrick Reed A | -- | -- | |
| Murray Floyd P | -- | -- | |
| Reynolds Danny J | -- | -- |
Source: Public Records
Mortgage History
| Date | Status | Borrower | Loan Amount |
|---|---|---|---|
| Open | Merrick Reed A | $5,946 | |
| Open | Merrick Reed A | $166,822 | |
| Previous Owner | Murray Floyd P | $33,600 | |
| Previous Owner | Murray Floyd P | $134,400 | |
| Previous Owner | Reynolds Danny J | $121,591 |
Source: Public Records
Tax History Compared to Growth
Tax History
| Year | Tax Paid | Tax Assessment Tax Assessment Total Assessment is a certain percentage of the fair market value that is determined by local assessors to be the total taxable value of land and additions on the property. | Land | Improvement |
|---|---|---|---|---|
| 2024 | $1,346 | $160,214 | $18,768 | $141,446 |
| 2023 | $1,346 | $130,143 | $18,768 | $111,375 |
| 2022 | $1,113 | $107,868 | $18,768 | $89,100 |
| 2021 | $1,169 | $51,160 | $10,322 | $40,838 |
| 2020 | $1,020 | $83,310 | $19,250 | $64,060 |
| 2019 | $980 | $79,119 | $19,250 | $59,869 |
| 2018 | $944 | $76,268 | $19,250 | $57,018 |
| 2017 | $9 | $76,268 | $19,250 | $57,018 |
| 2016 | $953 | $84,563 | $19,250 | $65,313 |
| 2015 | $899 | $86,616 | $19,250 | $67,366 |
| 2014 | $856 | $83,408 | $19,250 | $64,158 |
| 2013 | $874 | $83,408 | $19,250 | $64,158 |
Source: Public Records
Map
Nearby Homes