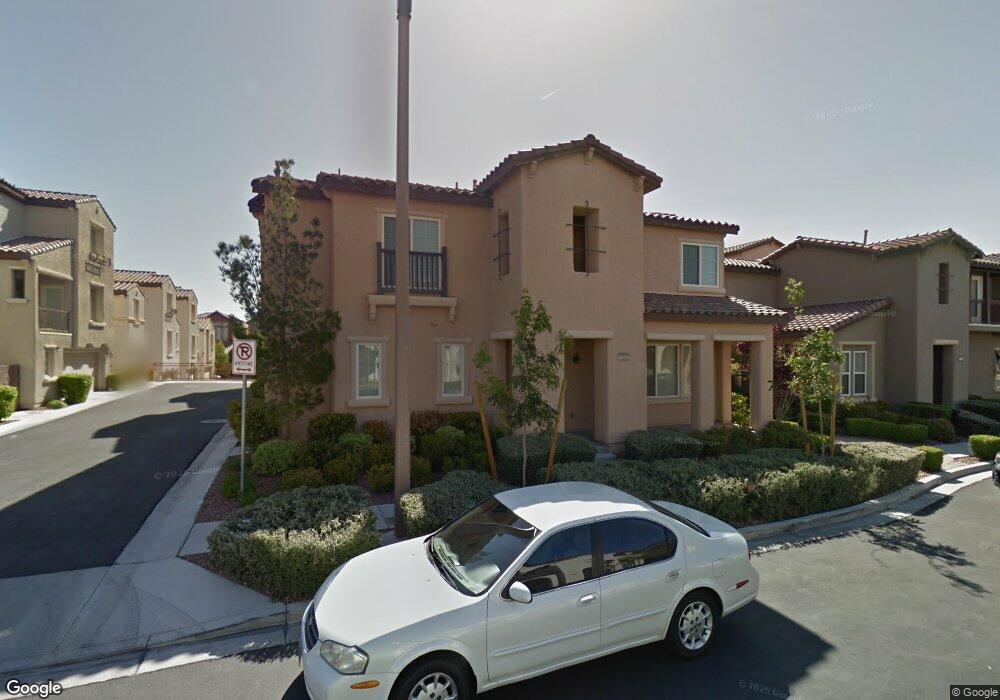
1928 Granemore St Las Vegas, NV 89135
Summerlin NeighborhoodEstimated Value: $523,101 - $587,000
3
Beds
3
Baths
1,990
Sq Ft
$275/Sq Ft
Est. Value
About This Home
This home is located at 1928 Granemore St, Las Vegas, NV 89135 and is currently estimated at $547,275, approximately $275 per square foot. 1928 Granemore St is a home located in Clark County with nearby schools including Judy & John L. Goolsby Elementary School, Palo Verde High School, and The Alexander Dawson School at Rainbow Mountain.
Ownership History
Date
Name
Owned For
Owner Type
Purchase Details
Closed on
May 27, 2010
Sold by
Fannie Mae
Bought by
Choi Kyeong Mi
Current Estimated Value
Home Financials for this Owner
Home Financials are based on the most recent Mortgage that was taken out on this home.
Original Mortgage
$184,021
Outstanding Balance
$123,814
Interest Rate
5.05%
Mortgage Type
FHA
Estimated Equity
$423,461
Purchase Details
Closed on
Apr 2, 2010
Sold by
Metlife Home Loans
Bought by
Federal National Mortgage Association
Home Financials for this Owner
Home Financials are based on the most recent Mortgage that was taken out on this home.
Original Mortgage
$184,021
Outstanding Balance
$123,814
Interest Rate
5.05%
Mortgage Type
FHA
Estimated Equity
$423,461
Purchase Details
Closed on
Feb 24, 2010
Sold by
Engel Linda
Bought by
Metlife Home Loans
Purchase Details
Closed on
Jul 24, 2007
Sold by
Ryland Homes Nevada Llc
Bought by
Engel Linda
Home Financials for this Owner
Home Financials are based on the most recent Mortgage that was taken out on this home.
Original Mortgage
$248,000
Interest Rate
6.65%
Mortgage Type
Unknown
Create a Home Valuation Report for This Property
The Home Valuation Report is an in-depth analysis detailing your home's value as well as a comparison with similar homes in the area
Home Values in the Area
Average Home Value in this Area
Purchase History
| Date | Buyer | Sale Price | Title Company |
|---|---|---|---|
| Choi Kyeong Mi | $186,500 | Old Republic Title Company | |
| Federal National Mortgage Association | $279,922 | None Available | |
| Metlife Home Loans | $279,922 | None Available | |
| Engel Linda | $310,000 | Ryland Title |
Source: Public Records
Mortgage History
| Date | Status | Borrower | Loan Amount |
|---|---|---|---|
| Open | Choi Kyeong Mi | $184,021 | |
| Previous Owner | Engel Linda | $248,000 |
Source: Public Records
Tax History Compared to Growth
Tax History
| Year | Tax Paid | Tax Assessment Tax Assessment Total Assessment is a certain percentage of the fair market value that is determined by local assessors to be the total taxable value of land and additions on the property. | Land | Improvement |
|---|---|---|---|---|
| 2025 | $2,630 | $137,121 | $51,450 | $85,671 |
| 2024 | $2,436 | $137,121 | $51,450 | $85,671 |
| 2023 | $1,622 | $119,019 | $38,150 | $80,869 |
| 2022 | $2,256 | $104,052 | $30,450 | $73,602 |
| 2021 | $2,089 | $98,609 | $28,700 | $69,909 |
| 2020 | $1,937 | $96,047 | $26,950 | $69,097 |
| 2019 | $1,815 | $89,680 | $22,050 | $67,630 |
| 2018 | $1,732 | $85,322 | $20,300 | $65,022 |
| 2017 | $2,526 | $85,756 | $20,300 | $65,456 |
| 2016 | $1,622 | $80,542 | $14,350 | $66,192 |
| 2015 | $1,618 | $61,856 | $9,800 | $52,056 |
| 2014 | $1,571 | $51,580 | $7,700 | $43,880 |
Source: Public Records
Map
Nearby Homes
- 1837 Ardilea St
- 1885 Cape Cod Landing Dr
- 1871 Granemore St
- 2031 Ardilea St
- 2043 Ardilea St
- 11239 Eureka Pass Ct
- 11347 Belmont Lake Dr Unit 102
- 11420 Ogden Mills Dr Unit 101
- 11422 Belmont Lake Dr Unit 104
- 11428 Belmont Lake Dr Unit 102
- 11428 Belmont Lake Dr Unit 101
- 1995 Alcova Ridge Dr
- 11489 Belmont Lake Dr Unit 106
- 11379 Gravitation Dr
- 11238 Essence Point Ave Unit 201
- 11257 Rainbow Peak Ave Unit 208
- 11238 Essence Point Ave Unit 205
- 11230 Hidden Peak Ave Unit 203
- 11250 Hidden Peak Ave Unit 201
- 11250 Hidden Peak Ave Unit 305
- 1922 Granemore St
- 1922 Granemore St
- 1922 Granemore St
- 1922 Granemore St
- 1944 Granemore St
- 1916 Granemore St
- 1898 Granemore St
- 1950 Granemore St
- 1904 Granemore St
- 1956 Granemore St
- 1901 Ardilea St
- 1929 Granemore St
- 1910 Granemore St
- 1945 Granemore St
- 1941 Ardilea St
- 1895 Ardilea St
- 1907 Ardilea St
- 1899 Granemore St
- 1899 Granemore St
- 1923 Granemore St Unit n/a