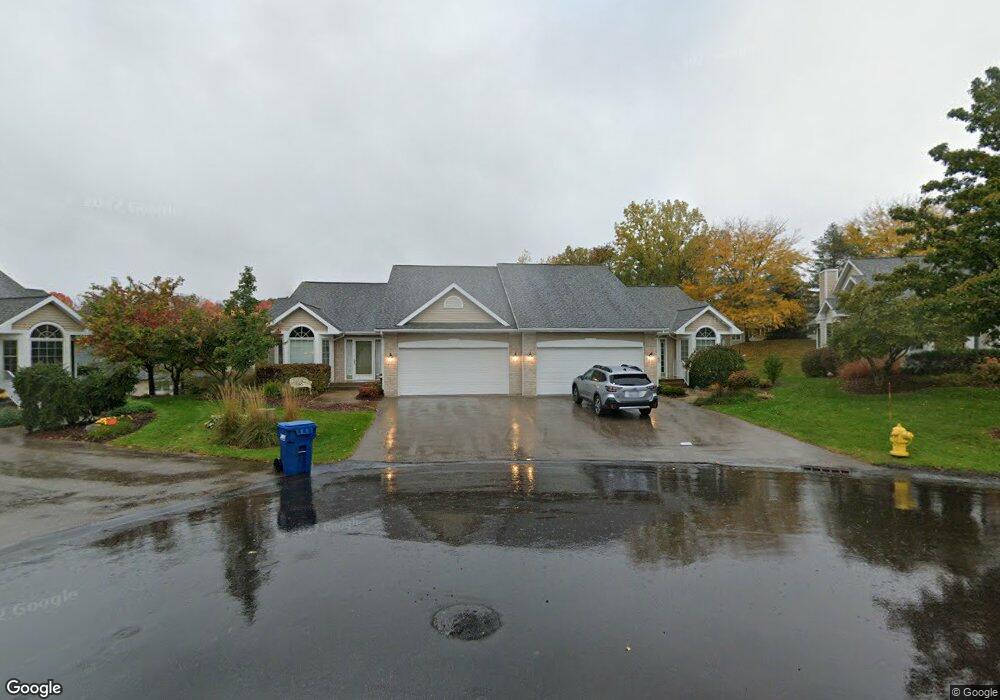
1929 Dunlin Ct NE Grand Rapids, MI 49505
North East Citizens Action NeighborhoodEstimated Value: $375,000 - $433,000
3
Beds
2
Baths
1,377
Sq Ft
$299/Sq Ft
Est. Value
About This Home
This home is located at 1929 Dunlin Ct NE, Grand Rapids, MI 49505 and is currently estimated at $411,370, approximately $298 per square foot. 1929 Dunlin Ct NE is a home located in Kent County with nearby schools including Riverside Middle School, Union High School, and Knapp Charter Academy.
Ownership History
Date
Name
Owned For
Owner Type
Purchase Details
Closed on
May 31, 2022
Sold by
Hooker William C and Hooker Therese M
Bought by
Hooker William C and Hooker William C
Current Estimated Value
Purchase Details
Closed on
Jul 26, 2021
Sold by
Beuker Thomas M and Theresa J Slabbekoom Trust
Bought by
Hooker William and Hooker Theresa
Purchase Details
Closed on
Feb 18, 2017
Sold by
Slabbekoorn Thressa and Slabbekoorn Harold J
Bought by
Slabbekoorn Thressa J and The Thressa J Slabbekoorn Trus
Purchase Details
Closed on
Aug 20, 2003
Sold by
Slabbekoorn Thressa and Groot Thressa Thressa J
Bought by
Slabbekoorn Harold J and Slabbekoorn Thressa
Home Financials for this Owner
Home Financials are based on the most recent Mortgage that was taken out on this home.
Original Mortgage
$42,200
Interest Rate
6.44%
Mortgage Type
Purchase Money Mortgage
Purchase Details
Closed on
Jun 22, 2000
Bought by
Slabbekoorn Groot T and Slabbekoorn Harold J Thressa
Create a Home Valuation Report for This Property
The Home Valuation Report is an in-depth analysis detailing your home's value as well as a comparison with similar homes in the area
Home Values in the Area
Average Home Value in this Area
Purchase History
| Date | Buyer | Sale Price | Title Company |
|---|---|---|---|
| Hooker William C | -- | None Listed On Document | |
| Hooker William | $320,000 | Chicago Title Of Mi Inc | |
| Slabbekoorn Thressa J | -- | None Available | |
| Slabbekoorn Harold J | -- | -- | |
| Slabbekoorn Groot T | $175,700 | -- |
Source: Public Records
Mortgage History
| Date | Status | Borrower | Loan Amount |
|---|---|---|---|
| Previous Owner | Slabbekoorn Harold J | $42,200 |
Source: Public Records
Tax History Compared to Growth
Tax History
| Year | Tax Paid | Tax Assessment Tax Assessment Total Assessment is a certain percentage of the fair market value that is determined by local assessors to be the total taxable value of land and additions on the property. | Land | Improvement |
|---|---|---|---|---|
| 2025 | $5,104 | $189,300 | $0 | $0 |
| 2024 | $5,104 | $168,200 | $0 | $0 |
| 2023 | $5,179 | $156,900 | $0 | $0 |
| 2022 | $4,916 | $146,000 | $0 | $0 |
| 2021 | $3,588 | $145,000 | $0 | $0 |
| 2020 | $3,430 | $141,300 | $0 | $0 |
| 2019 | $3,593 | $137,100 | $0 | $0 |
| 2018 | $3,469 | $130,600 | $0 | $0 |
| 2017 | $3,378 | $115,900 | $0 | $0 |
| 2016 | $3,418 | $100,900 | $0 | $0 |
| 2015 | $3,179 | $100,900 | $0 | $0 |
| 2013 | -- | $93,900 | $0 | $0 |
Source: Public Records
Map
Nearby Homes
- 2324 Whimbrel Ct NE
- 2041 Krislin St
- 1600 Cherry Hill Dr NE
- 2016 Tall Meadow St NE
- 2151 Chelsea Rd NE
- 2058 Ken Ade St NE Unit 147
- 2037 Tall Meadow St NE Unit 13
- 1410 Rothbury Dr NE
- 2112 Jo Dean Ct NE
- 2353 Midvale St NE
- 1336 Banbury Ave NE
- 2078 Celadon Dr NE Unit 92
- 2420 Hylane Ct NE
- 1261 Banbury Ave NE
- 2157 New Town Dr NE Unit 10
- 1250 Walwood Dr NE
- 2032 Celadon Dr NE
- 2194 New Town Dr NE
- 2753 Dean Lake Ave NE
- 1759 Briarcliff Dr NE
- 1931 Dunlin Ct NE
- 1931 Dunlin Ct NE Unit 22
- 1927 Dunlin Ct NE
- 1933 Dunlin Ct NE
- 1918 Dunlin Ct NE Unit 19
- 1920 Dunlin Ct NE Unit 18
- 1941 Dunlin Ct NE
- 1926 Dunlin Ct NE
- 1926 Dunlin Ct NE Unit 17
- 1934 Dunlin Ct NE
- 1934 Dunlin Ct NE Unit 14
- 1928 Dunlin Ct NE
- 1936 Dunlin Ct NE
- 1943 Dunlin Ct NE
- 1858 Turnstone Ln NE Unit 30
- 2307 Whimbrel Ct NE
- 2309 Whimbrel Ct NE
- 2325 Whimbrel Ct NE
- 1938 Dunlin Ct NE
- 1856 Turnstone Ln NE Unit 31