Estimated Value: $174,000 - $252,000
3
Beds
2
Baths
1,188
Sq Ft
$182/Sq Ft
Est. Value
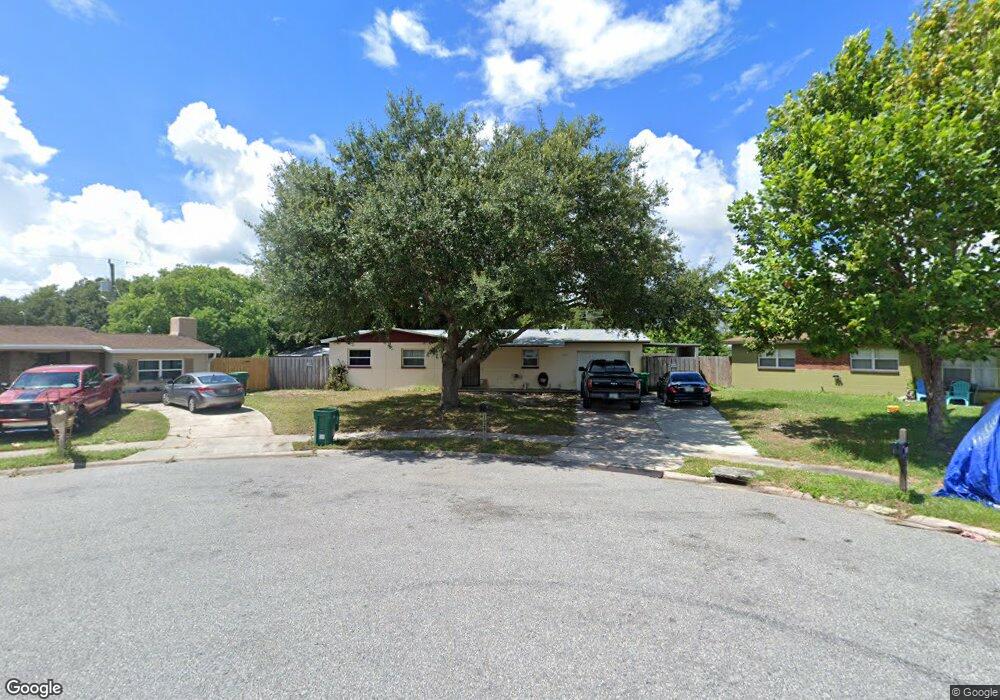
About This Home
This home is located at 1929 Furman Ct, Cocoa, FL 32922 and is currently estimated at $216,596, approximately $182 per square foot. 1929 Furman Ct is a home located in Brevard County with nearby schools including Cambridge Elementary Magnet School, Cocoa High School, and Emma Jewel Charter Academy.
Ownership History
Date
Name
Owned For
Owner Type
Purchase Details
Closed on
Mar 31, 2002
Sold by
Demmer Kenneth A
Bought by
Walters David
Current Estimated Value
Home Financials for this Owner
Home Financials are based on the most recent Mortgage that was taken out on this home.
Original Mortgage
$38,600
Outstanding Balance
$15,990
Interest Rate
6.8%
Estimated Equity
$200,606
Purchase Details
Closed on
Feb 24, 1999
Sold by
Defibaugh Debra K and Sides Debra K
Bought by
Demmer Kenneth A
Purchase Details
Closed on
Feb 14, 1995
Sold by
Sullivan Michael P
Bought by
Sides Debra K
Home Financials for this Owner
Home Financials are based on the most recent Mortgage that was taken out on this home.
Original Mortgage
$51,000
Interest Rate
9.21%
Purchase Details
Closed on
Jun 17, 1994
Sold by
Hays Ted C and Hays Mary F
Bought by
Sullivan Michael P
Home Financials for this Owner
Home Financials are based on the most recent Mortgage that was taken out on this home.
Original Mortgage
$39,000
Interest Rate
8.52%
Create a Home Valuation Report for This Property
The Home Valuation Report is an in-depth analysis detailing your home's value as well as a comparison with similar homes in the area
Home Values in the Area
Average Home Value in this Area
Purchase History
| Date | Buyer | Sale Price | Title Company |
|---|---|---|---|
| Walters David | $42,000 | -- | |
| Demmer Kenneth A | $36,000 | -- | |
| Sides Debra K | $55,000 | -- | |
| Sullivan Michael P | $43,100 | -- |
Source: Public Records
Mortgage History
| Date | Status | Borrower | Loan Amount |
|---|---|---|---|
| Open | Walters David | $38,600 | |
| Previous Owner | Sides Debra K | $51,000 | |
| Previous Owner | Sullivan Michael P | $39,000 |
Source: Public Records
Tax History
| Year | Tax Paid | Tax Assessment Tax Assessment Total Assessment is a certain percentage of the fair market value that is determined by local assessors to be the total taxable value of land and additions on the property. | Land | Improvement |
|---|---|---|---|---|
| 2025 | $792 | $45,360 | -- | -- |
| 2024 | $761 | $44,090 | -- | -- |
| 2023 | $761 | $42,810 | $0 | $0 |
| 2022 | $705 | $41,570 | $0 | $0 |
| 2021 | $680 | $40,360 | $0 | $0 |
| 2020 | $655 | $39,810 | $0 | $0 |
| 2019 | $628 | $38,920 | $0 | $0 |
| 2018 | $504 | $38,200 | $0 | $0 |
| 2017 | $491 | $37,420 | $0 | $0 |
| 2016 | $474 | $36,660 | $9,000 | $27,660 |
| 2015 | $470 | $36,410 | $9,000 | $27,410 |
| 2014 | $417 | $36,130 | $10,000 | $26,130 |
Source: Public Records
Map
Nearby Homes
- 2016 Cooper Dr
- 1326 Stetson Ct
- 2029 Ivy Dr
- 1354 S Stetson Dr
- 1723 Dixon Blvd Unit 4
- 1750 Rosa St
- 1417 Walter St
- 1711 Dixon Blvd Unit 198
- 0 University Ln
- Xxx Rosetine St
- 0000 Null Unknown
- 0000 N Range Rd
- 703 Venus Dr
- 1523 Clearlake Ct
- 1531 Paradise Ln
- 1644 Ruth St
- 1301 N Range Rd
- 717 Lunar Lake Cir
- 1523 Furnari St
- 2515 Fairfield Dr
- 1925 Furman Ct
- 1931 Furman Ct
- 1930 Ivy Dr
- 1404 E Stetson Dr
- 1921 Furman Ct
- 1406 E Stetson Dr
- 1935 Furman Ct
- 1934 Ivy Dr
- 1408 E Stetson Dr
- 1408 E Stetson Dr
- 1922 Furman Ct
- 1917 Furman Ct
- 1410 E Stetson Dr
- 1939 Furman Ct
- 1918 Ivy Dr
- 1926 Ivy Dr
- 1918 Furman Ct
- 1405 E Stetson Dr
- 1913 Furman Ct
- 1954 Furman Ct
Your Personal Tour Guide
Ask me questions while you tour the home.