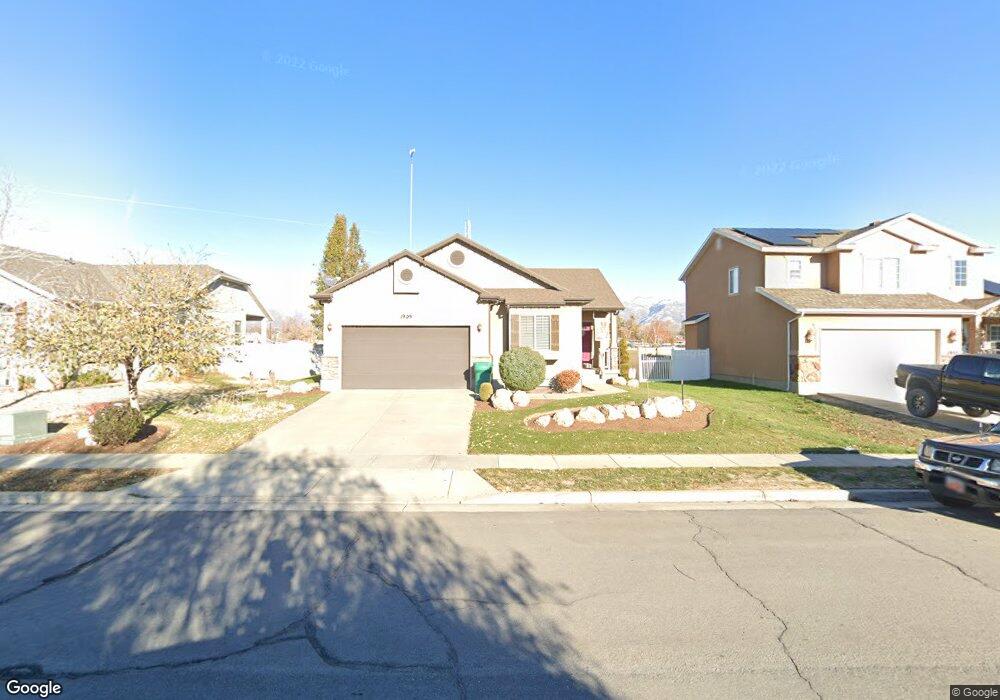
1929 James Cir Clearfield, UT 84015
Estimated Value: $470,000 - $523,000
3
Beds
2
Baths
1,178
Sq Ft
$411/Sq Ft
Est. Value
About This Home
This home is located at 1929 James Cir, Clearfield, UT 84015 and is currently estimated at $484,038, approximately $410 per square foot. 1929 James Cir is a home located in Davis County with nearby schools including Doxey Elementary School, North Davis Junior High School, and Clearfield High School.
Ownership History
Date
Name
Owned For
Owner Type
Purchase Details
Closed on
Mar 23, 2020
Sold by
Layton Jeremy
Bought by
Layton Jeremiah J
Current Estimated Value
Home Financials for this Owner
Home Financials are based on the most recent Mortgage that was taken out on this home.
Original Mortgage
$223,000
Outstanding Balance
$197,122
Interest Rate
3.4%
Mortgage Type
New Conventional
Estimated Equity
$286,916
Purchase Details
Closed on
Jun 13, 2014
Sold by
Layton Jeremy
Bought by
Layton Jeremy and Layton Rachael
Home Financials for this Owner
Home Financials are based on the most recent Mortgage that was taken out on this home.
Original Mortgage
$185,300
Interest Rate
4.16%
Mortgage Type
New Conventional
Purchase Details
Closed on
Feb 23, 2011
Sold by
Ivory Homes Ltd
Bought by
Layton Jeremy
Home Financials for this Owner
Home Financials are based on the most recent Mortgage that was taken out on this home.
Original Mortgage
$8,900
Interest Rate
4.67%
Mortgage Type
Stand Alone Second
Create a Home Valuation Report for This Property
The Home Valuation Report is an in-depth analysis detailing your home's value as well as a comparison with similar homes in the area
Home Values in the Area
Average Home Value in this Area
Purchase History
| Date | Buyer | Sale Price | Title Company |
|---|---|---|---|
| Layton Jeremiah J | -- | Cottonwood Title Insurance | |
| Layton Jeremy | -- | None Available | |
| Layton Jeremy | -- | Cottonwood Title Ins Agency | |
| Ivory Homes Ltd | -- | Cottonwood Title Ins Agency |
Source: Public Records
Mortgage History
| Date | Status | Borrower | Loan Amount |
|---|---|---|---|
| Open | Layton Jeremiah J | $223,000 | |
| Closed | Layton Jeremy | $185,300 | |
| Closed | Ivory Homes Ltd | $8,900 | |
| Closed | Layton Jeremy | $181,186 |
Source: Public Records
Tax History
| Year | Tax Paid | Tax Assessment Tax Assessment Total Assessment is a certain percentage of the fair market value that is determined by local assessors to be the total taxable value of land and additions on the property. | Land | Improvement |
|---|---|---|---|---|
| 2025 | $2,682 | $240,350 | $65,215 | $175,135 |
| 2024 | $2,596 | $234,300 | $62,396 | $171,904 |
| 2023 | $2,396 | $397,000 | $100,527 | $296,473 |
| 2022 | $2,590 | $232,100 | $58,237 | $173,863 |
| 2021 | $2,393 | $324,000 | $58,488 | $265,512 |
| 2020 | $2,082 | $280,000 | $48,575 | $231,425 |
| 2019 | $2,027 | $269,000 | $53,204 | $215,796 |
| 2018 | $1,964 | $254,000 | $47,224 | $206,776 |
| 2016 | $1,746 | $118,030 | $18,637 | $99,393 |
| 2015 | $1,725 | $111,210 | $18,637 | $92,573 |
| 2014 | $1,691 | $110,453 | $18,637 | $91,816 |
| 2013 | -- | $87,114 | $30,294 | $56,820 |
Source: Public Records
Map
Nearby Homes
- 83 W 650 N
- 62 Villa Dr
- 151 W 700 N
- 47 Villa Dr
- 150 W 750 N
- 463 N 200 W
- 488 Fern Dr
- 482 Vickie Ln
- 156 W 300 N
- 446 Fern Dr
- 285 N Main St Unit 308
- 54 W 250 N
- 137 W 250 N
- 75 W 250 N Unit 78
- 75 W 250 N Unit 31
- 75 W 250 N Unit 110
- 75 W 250 N Unit 56
- 75 W 250 N Unit 84
- 75 W 250 N Unit 13
- 75 W 250 N Unit 12
Your Personal Tour Guide
Ask me questions while you tour the home.