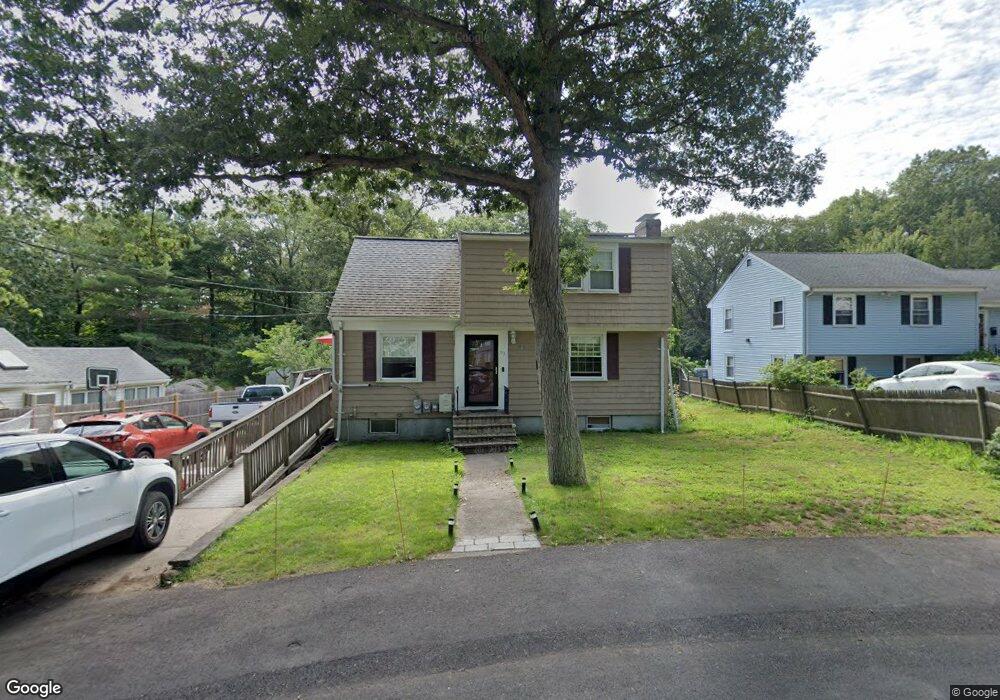
193 Belmont St Weymouth, MA 02188
South Weymouth NeighborhoodEstimated Value: $724,956 - $915,000
4
Beds
3
Baths
1,964
Sq Ft
$402/Sq Ft
Est. Value
About This Home
This home is located at 193 Belmont St, Weymouth, MA 02188 and is currently estimated at $789,739, approximately $402 per square foot. 193 Belmont St is a home located in Norfolk County with nearby schools including Frederick C Murphy, Abigail Adams Middle School, and Weymouth Middle School Chapman.
Ownership History
Date
Name
Owned For
Owner Type
Purchase Details
Closed on
Oct 16, 1997
Sold by
Sherrick Warren F and Sherrick Virginia A
Bought by
Villarreal Ray J and Villarreal Joan M
Current Estimated Value
Home Financials for this Owner
Home Financials are based on the most recent Mortgage that was taken out on this home.
Original Mortgage
$170,500
Interest Rate
7.46%
Mortgage Type
Purchase Money Mortgage
Create a Home Valuation Report for This Property
The Home Valuation Report is an in-depth analysis detailing your home's value as well as a comparison with similar homes in the area
Home Values in the Area
Average Home Value in this Area
Purchase History
| Date | Buyer | Sale Price | Title Company |
|---|---|---|---|
| Villarreal Ray J | $179,500 | -- |
Source: Public Records
Mortgage History
| Date | Status | Borrower | Loan Amount |
|---|---|---|---|
| Open | Villarreal Ray J | $190,000 | |
| Closed | Villarreal Ray J | $175,000 | |
| Closed | Villarreal Ray J | $170,500 |
Source: Public Records
Tax History Compared to Growth
Tax History
| Year | Tax Paid | Tax Assessment Tax Assessment Total Assessment is a certain percentage of the fair market value that is determined by local assessors to be the total taxable value of land and additions on the property. | Land | Improvement |
|---|---|---|---|---|
| 2025 | $6,944 | $687,500 | $275,500 | $412,000 |
| 2024 | $6,727 | $655,000 | $262,400 | $392,600 |
| 2023 | $6,464 | $618,600 | $243,000 | $375,600 |
| 2022 | $6,081 | $530,600 | $206,300 | $324,300 |
| 2021 | $5,719 | $487,100 | $206,300 | $280,800 |
| 2020 | $5,538 | $464,600 | $206,300 | $258,300 |
| 2019 | $5,447 | $449,400 | $198,400 | $251,000 |
| 2018 | $5,271 | $421,700 | $188,900 | $232,800 |
| 2017 | $4,574 | $357,100 | $180,000 | $177,100 |
| 2016 | $4,435 | $346,500 | $173,100 | $173,400 |
| 2015 | $4,204 | $325,900 | $165,200 | $160,700 |
| 2014 | $4,014 | $301,800 | $153,700 | $148,100 |
Source: Public Records
Map
Nearby Homes
- 116 Belmont St
- 200 Justin Dr Unit 3
- 501 Commerce Dr Unit 2310
- 501 Commerce Dr Unit 1111
- 501 Commerce Dr Unit 4206
- 501 Commerce Dr Unit 4308
- 501 Commerce Dr Unit 4306
- 655 Summer St
- 255 West St
- 48 Apple Tree Ln
- 262 West St
- 54 Federal St
- 24 Blake Rd
- 2 Tara Dr Unit 1
- 92 Mercury St
- 33 Congress St
- 747 Middle St
- 215 Winter St Unit 1P
- 76 Kingman St
- 432 Grove St
- 187 Belmont St
- 201 Belmont St
- 185 Belmont St
- 107 Progress St
- 188 Belmont St
- 104 Progress St
- 210 Belmont St
- 177 Belmont St
- 180 Belmont St
- 215 Belmont St
- 209 Belmont St
- 96 Progress St
- 166 Belmont St
- 163 Belmont St
- 85 Progress St
- 88 Progress St
- 154 Belmont St
- 159 Belmont St
- 50 Jacquelyn Rd
- 80 Progress St