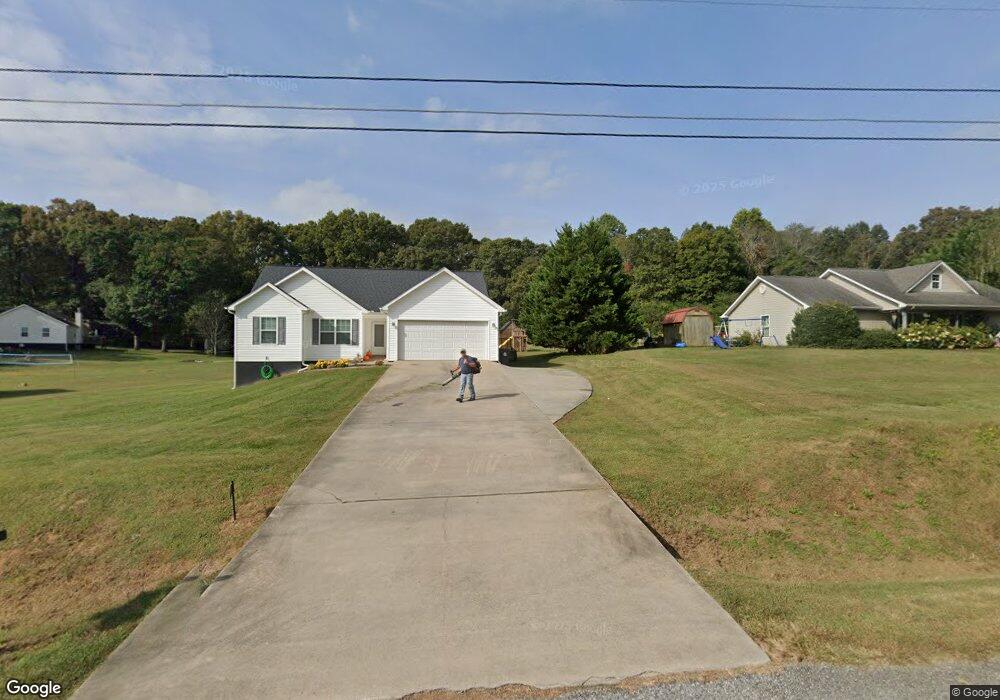
193 Cainbridge Meadows Demorest, GA 30535
Estimated Value: $240,000 - $312,000
3
Beds
2
Baths
1,065
Sq Ft
$259/Sq Ft
Est. Value
About This Home
This home is located at 193 Cainbridge Meadows, Demorest, GA 30535 and is currently estimated at $276,034, approximately $259 per square foot. 193 Cainbridge Meadows is a home located in Habersham County with nearby schools including Fairview Elementary School, North Habersham Middle School, and Habersham Success Academy.
Ownership History
Date
Name
Owned For
Owner Type
Purchase Details
Closed on
Jul 28, 2023
Sold by
Taylor Bronson
Bought by
Herbert Marnie K and Sprinkle Austin K
Current Estimated Value
Home Financials for this Owner
Home Financials are based on the most recent Mortgage that was taken out on this home.
Original Mortgage
$234,000
Outstanding Balance
$228,568
Interest Rate
6.71%
Mortgage Type
New Conventional
Estimated Equity
$47,466
Purchase Details
Closed on
Jun 2, 2009
Sold by
Brooks Stephanie L
Bought by
Taylor Bean
Purchase Details
Closed on
Sep 1, 2006
Sold by
Not Provided
Bought by
Taylor Bronson
Home Financials for this Owner
Home Financials are based on the most recent Mortgage that was taken out on this home.
Original Mortgage
$123,420
Interest Rate
6.52%
Mortgage Type
New Conventional
Create a Home Valuation Report for This Property
The Home Valuation Report is an in-depth analysis detailing your home's value as well as a comparison with similar homes in the area
Home Values in the Area
Average Home Value in this Area
Purchase History
| Date | Buyer | Sale Price | Title Company |
|---|---|---|---|
| Herbert Marnie K | $260,000 | -- | |
| Taylor Bean | $129,063 | -- | |
| Taylor Bronson | $123,500 | -- |
Source: Public Records
Mortgage History
| Date | Status | Borrower | Loan Amount |
|---|---|---|---|
| Open | Herbert Marnie K | $234,000 | |
| Previous Owner | Taylor Bean | $107,142 | |
| Previous Owner | Taylor Bronson | $123,420 |
Source: Public Records
Tax History Compared to Growth
Tax History
| Year | Tax Paid | Tax Assessment Tax Assessment Total Assessment is a certain percentage of the fair market value that is determined by local assessors to be the total taxable value of land and additions on the property. | Land | Improvement |
|---|---|---|---|---|
| 2025 | $2,563 | $106,098 | $16,000 | $90,098 |
| 2024 | $2,245 | $86,492 | $12,000 | $74,492 |
| 2023 | $1,073 | $86,220 | $12,000 | $74,220 |
| 2022 | $1,319 | $64,604 | $12,000 | $52,604 |
| 2021 | $1,258 | $58,604 | $12,000 | $46,604 |
| 2020 | $1,156 | $47,976 | $8,000 | $39,976 |
| 2019 | $1,158 | $47,976 | $8,000 | $39,976 |
| 2018 | $1,151 | $47,976 | $8,000 | $39,976 |
| 2017 | $1,101 | $44,164 | $8,000 | $36,164 |
| 2016 | $946 | $95,700 | $4,000 | $34,280 |
| 2015 | $935 | $95,700 | $4,000 | $34,280 |
| 2014 | $924 | $92,980 | $4,000 | $33,192 |
| 2013 | -- | $31,896 | $4,000 | $27,896 |
Source: Public Records
Map
Nearby Homes
- 121 Windchime Cir
- 320 Cainbridge Meadows
- 368 Dixon Rd
- 132 Fairview Meadows Dr
- 0 Wheeler Rd Unit 22579726
- 1045 Fairview School Rd
- 573 Mineral Springs Trl Conn
- 663 Wheeler Rd
- 2600 Georgia 115
- 116 Savannah Terrace
- 0 Twin River Orchard Rd Unit 7194756
- 0 Twin River Orchard Rd Unit 20112390
- 7 ACRES Wheeler Rd
- 186 Sweetbriar Dr Unit LOT 10
- 186 Sweetbriar Dr
- 332 Mineral Springs Trail
- 0 N Falling Waters Dr Unit LOT 32B
- 1008 River Estates Rd
- 303 Chitwood Rd
- 618 Riverside Dr
- 181 Cainbridge Meadows
- 205 Cainbridge Meadows
- 205 Cainbridge Meadows
- 122 Windchime Cir
- 122 Windchimes Cir
- 175 Cainbridge Meadows
- 175 Cainbridge Meadows Unit 5
- 180 Cainbridge Meadows Unit 40
- 180 Cainbridge Meadows
- 126 Windchimes Cir
- 175 Cain Bridge Meadows Rd Unit 5
- 236 Cainbridge Meadows
- 0 Cain Bridge Meadows Unit 3190259
- 0 Cain Bridge Meadows Unit 7035280
- DRIVE Cain Bridge Meadows
- 121 Windchime Cir Unit 34
- 121 Windchimes Cir
- 136 Windchime Cir
- 155 Cainbridge Meadows
- 136 Windchimes Cir