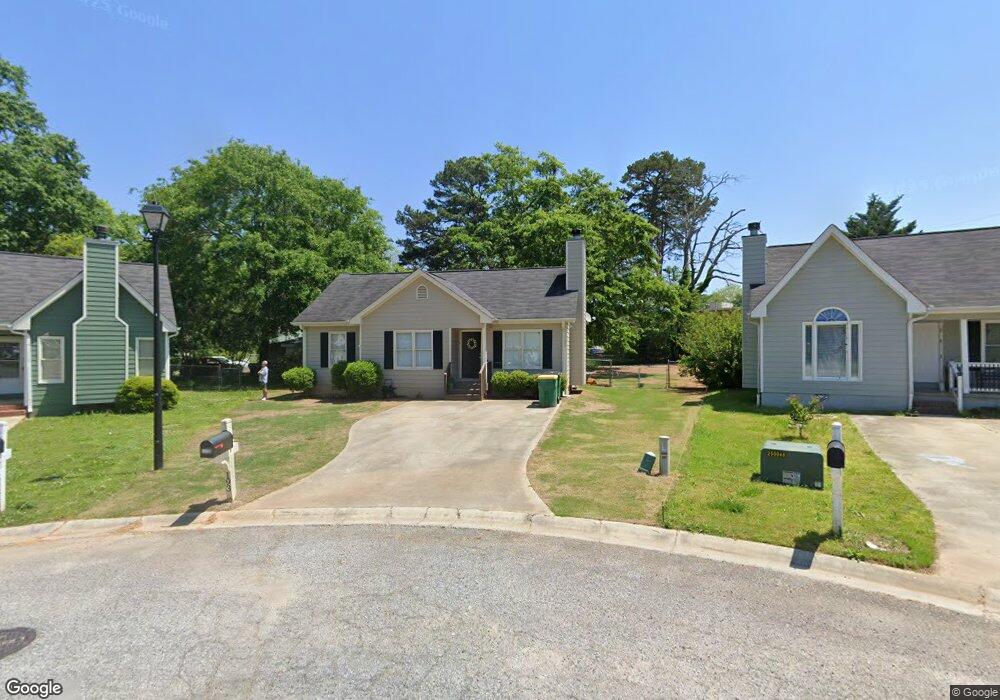
193 Charles Ct Winder, GA 30680
Estimated Value: $235,380 - $280,000
3
Beds
2
Baths
1,050
Sq Ft
$243/Sq Ft
Est. Value
About This Home
This home is located at 193 Charles Ct, Winder, GA 30680 and is currently estimated at $255,595, approximately $243 per square foot. 193 Charles Ct is a home located in Barrow County with nearby schools including County Line Elementary School, Russell Middle School, and Winder-Barrow High School.
Ownership History
Date
Name
Owned For
Owner Type
Purchase Details
Closed on
Mar 29, 2019
Sold by
Mbor Investments Llc
Bought by
Hamby Jeremy
Current Estimated Value
Home Financials for this Owner
Home Financials are based on the most recent Mortgage that was taken out on this home.
Original Mortgage
$142,424
Outstanding Balance
$124,445
Interest Rate
4.3%
Mortgage Type
New Conventional
Estimated Equity
$131,150
Purchase Details
Closed on
Apr 3, 2015
Sold by
Manor Holdings Llc
Bought by
Mbor Investments Llc
Purchase Details
Closed on
Apr 1, 2014
Sold by
Driftwood Investment Prope
Bought by
Manor Holdings Llc and Maverick Land Co Llc
Purchase Details
Closed on
Jul 28, 1998
Sold by
Reproductions Harwell
Bought by
Page Phillip A
Home Financials for this Owner
Home Financials are based on the most recent Mortgage that was taken out on this home.
Original Mortgage
$69,743
Interest Rate
6.94%
Mortgage Type
New Conventional
Create a Home Valuation Report for This Property
The Home Valuation Report is an in-depth analysis detailing your home's value as well as a comparison with similar homes in the area
Home Values in the Area
Average Home Value in this Area
Purchase History
| Date | Buyer | Sale Price | Title Company |
|---|---|---|---|
| Hamby Jeremy | $141,000 | -- | |
| Hamby Jeremy | -- | -- | |
| Mbor Investments Llc | -- | -- | |
| Manor Holdings Llc | $146,001 | -- | |
| Page Phillip A | $71,900 | -- |
Source: Public Records
Mortgage History
| Date | Status | Borrower | Loan Amount |
|---|---|---|---|
| Open | Hamby Jeremy | $142,424 | |
| Closed | Hamby Jeremy | $142,424 | |
| Previous Owner | Page Phillip A | $69,743 |
Source: Public Records
Tax History
| Year | Tax Paid | Tax Assessment Tax Assessment Total Assessment is a certain percentage of the fair market value that is determined by local assessors to be the total taxable value of land and additions on the property. | Land | Improvement |
|---|---|---|---|---|
| 2025 | $1,543 | $58,393 | $10,800 | $47,593 |
| 2024 | $1,545 | $56,937 | $10,800 | $46,137 |
| 2023 | $1,064 | $56,937 | $10,800 | $46,137 |
| 2022 | $1,732 | $52,691 | $10,800 | $41,891 |
| 2021 | $1,769 | $52,691 | $10,800 | $41,891 |
| 2020 | $1,736 | $52,691 | $10,800 | $41,891 |
| 2019 | $1,627 | $44,861 | $10,800 | $34,061 |
| 2018 | $1,236 | $33,138 | $10,000 | $23,138 |
| 2017 | $785 | $26,327 | $8,000 | $18,327 |
| 2016 | $905 | $25,880 | $8,000 | $17,880 |
| 2015 | $913 | $26,088 | $8,000 | $18,088 |
| 2014 | $841 | $23,784 | $5,488 | $18,296 |
| 2013 | -- | $22,710 | $5,488 | $17,222 |
Source: Public Records
Map
Nearby Homes
- 17 W Wright St
- 0 Jerome St Unit 10359679
- 10 W Wright St
- 59 W Wright St
- 160 N Broad St
- 18 E New St
- 131 Pinehurst Dr
- 5 W Kimball St
- 60 W Williams St
- 3 W Kimball St
- 1 W Kimball St
- 88 W New St
- 127 N Center St
- 352 3rd Ave
- 253 3rd Ave
- 209 Georgia Ave
- 317 Georgia Ave
- 267 Nancy St
- 284 E 5th Ave
- 136 Alexander Ct
Your Personal Tour Guide
Ask me questions while you tour the home.