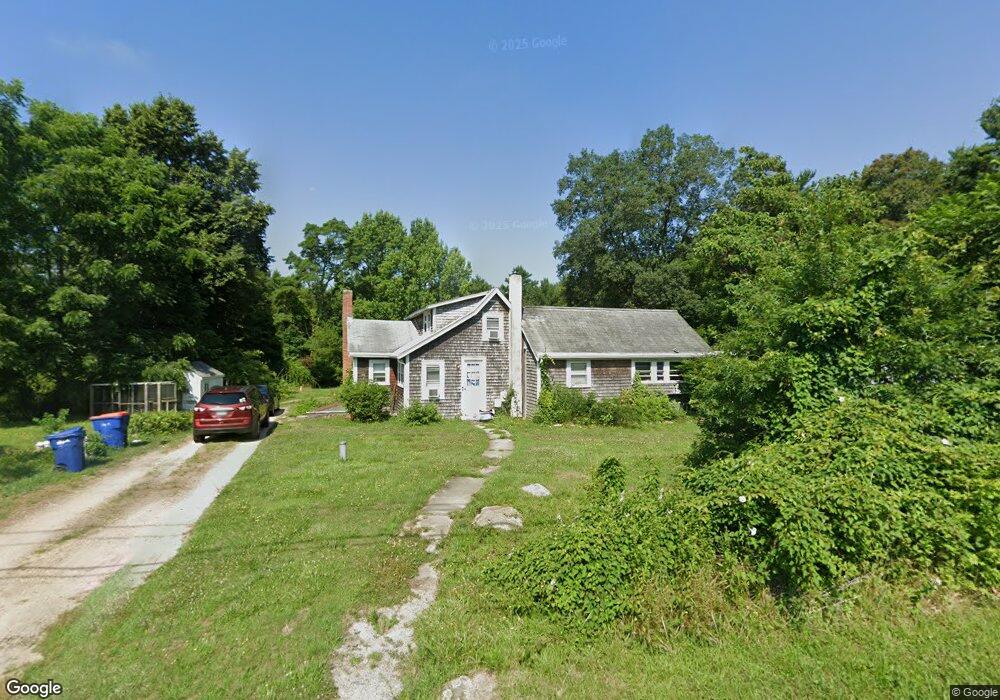
193 Cushman Rd Rochester, MA 02770
Estimated Value: $469,000 - $552,678
3
Beds
2
Baths
1,361
Sq Ft
$364/Sq Ft
Est. Value
About This Home
This home is located at 193 Cushman Rd, Rochester, MA 02770 and is currently estimated at $495,170, approximately $363 per square foot. 193 Cushman Rd is a home located in Plymouth County with nearby schools including Rochester Memorial School and Old Rochester Regional High School.
Ownership History
Date
Name
Owned For
Owner Type
Purchase Details
Closed on
Mar 16, 2023
Sold by
Lapointe Gregory M and Lapointe Janelle M
Bought by
Lapointe Gregory M and Lapointe Janeelle M
Current Estimated Value
Home Financials for this Owner
Home Financials are based on the most recent Mortgage that was taken out on this home.
Original Mortgage
$218,762
Outstanding Balance
$212,125
Interest Rate
6.32%
Mortgage Type
FHA
Estimated Equity
$283,045
Purchase Details
Closed on
Aug 29, 2014
Sold by
Liffers Margaret E and Hartley-Kleiman Kim
Bought by
Lapointe Gregory M
Home Financials for this Owner
Home Financials are based on the most recent Mortgage that was taken out on this home.
Original Mortgage
$158,400
Interest Rate
4.14%
Mortgage Type
New Conventional
Purchase Details
Closed on
Jul 28, 2011
Sold by
Campbell Nancy I
Bought by
Liffers Robert
Create a Home Valuation Report for This Property
The Home Valuation Report is an in-depth analysis detailing your home's value as well as a comparison with similar homes in the area
Home Values in the Area
Average Home Value in this Area
Purchase History
| Date | Buyer | Sale Price | Title Company |
|---|---|---|---|
| Lapointe Gregory M | -- | None Available | |
| Lapointe Gregory M | -- | None Available | |
| Lapointe Gregory M | $198,000 | -- | |
| Liffers Robert | $50,000 | -- | |
| Liffers Robert | $50,000 | -- |
Source: Public Records
Mortgage History
| Date | Status | Borrower | Loan Amount |
|---|---|---|---|
| Open | Lapointe Gregory M | $218,762 | |
| Closed | Lapointe Gregory M | $218,762 | |
| Previous Owner | Lapointe Gregory M | $158,400 |
Source: Public Records
Tax History Compared to Growth
Tax History
| Year | Tax Paid | Tax Assessment Tax Assessment Total Assessment is a certain percentage of the fair market value that is determined by local assessors to be the total taxable value of land and additions on the property. | Land | Improvement |
|---|---|---|---|---|
| 2025 | $4,522 | $417,900 | $185,900 | $232,000 |
| 2024 | $4,446 | $402,000 | $177,100 | $224,900 |
| 2023 | $4,395 | $370,300 | $177,100 | $193,200 |
| 2022 | $4,510 | $354,000 | $210,400 | $143,600 |
| 2021 | $4,373 | $327,100 | $197,600 | $129,500 |
| 2020 | $4,248 | $315,100 | $191,400 | $123,700 |
| 2019 | $3,882 | $277,300 | $180,300 | $97,000 |
| 2018 | $3,639 | $257,900 | $163,300 | $94,600 |
| 2017 | $3,636 | $252,700 | $161,100 | $91,600 |
| 2016 | $3,610 | $257,700 | $162,300 | $95,400 |
| 2015 | $3,609 | $256,500 | $162,300 | $94,200 |
| 2014 | $3,551 | $256,400 | $157,500 | $98,900 |
Source: Public Records
Map
Nearby Homes
- 0 Rounseville Rd
- 282 Cushman Rd
- 21 Robinson Rd
- 43 Hartley Rd
- 86 Pine St
- 220 Mattapoisett Rd
- 0 Confidential Way Unit 73340085
- 219 Leonard St
- 135 Pine St
- 661 Main St
- 649 Middle Rd
- 290 Mendell Rd
- 224 North St
- 489 Main St
- 6 Katlyn Cir
- 4 Hayley Cir
- 2 Hayley Cir
- 286 Mendall Rd
- 1 Crooked Bow Path
- 1-3 Doctor Hickey Ln
- 188 Cushman Rd
- 194 Cushman Rd
- 179 Cushman Rd
- 206 Cushman Rd
- 215 Cushman Rd
- 168 Cushman Rd
- 167 Cushman Rd
- 18 Jasons Ln
- 225 Cushman Rd
- 28 Jasons Ln
- 224 Cushman Rd
- 161 Cushman Rd
- 161 Cushman Rd
- 161 Cushman Rd Unit Year Round
- 38 Jasons Ln
- 229 Cushman Rd
- 15 Jasons Ln
- 232 Cushman Rd
- 29 Jasons Ln
- 149 Cushman Rd