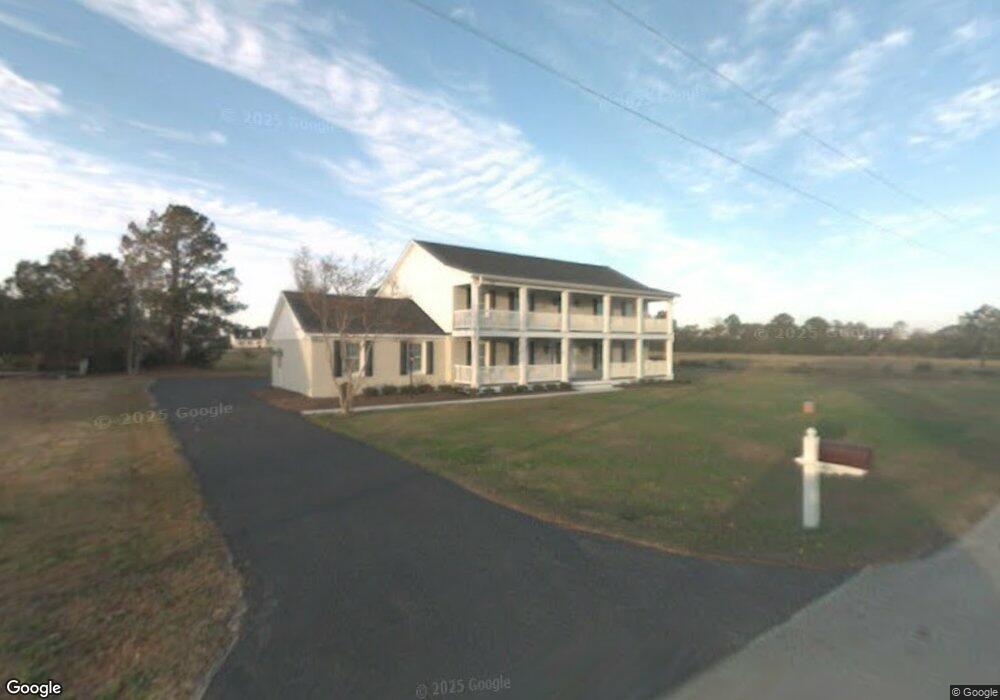
193 Gibbs Creek Rd Beaufort, NC 28516
Estimated Value: $479,000 - $728,000
3
Beds
3
Baths
3,162
Sq Ft
$192/Sq Ft
Est. Value
About This Home
This home is located at 193 Gibbs Creek Rd, Beaufort, NC 28516 and is currently estimated at $605,680, approximately $191 per square foot. 193 Gibbs Creek Rd is a home located in Carteret County with nearby schools including Beaufort Elementary School, Beaufort Middle School, and East Carteret High School.
Ownership History
Date
Name
Owned For
Owner Type
Purchase Details
Closed on
Apr 5, 2011
Sold by
Cornerstone Bank
Bought by
Hall Robert C and Hall Nancy B
Current Estimated Value
Home Financials for this Owner
Home Financials are based on the most recent Mortgage that was taken out on this home.
Original Mortgage
$300,000
Outstanding Balance
$207,456
Interest Rate
4.85%
Mortgage Type
New Conventional
Estimated Equity
$398,224
Purchase Details
Closed on
Aug 18, 2010
Sold by
Baytree I Llc
Bought by
Cornerstone Bank
Purchase Details
Closed on
May 11, 2006
Sold by
Lilly Thomas T and Lilly Linda P
Bought by
Baytree I Llc
Home Financials for this Owner
Home Financials are based on the most recent Mortgage that was taken out on this home.
Original Mortgage
$280,000
Interest Rate
6.41%
Mortgage Type
Purchase Money Mortgage
Create a Home Valuation Report for This Property
The Home Valuation Report is an in-depth analysis detailing your home's value as well as a comparison with similar homes in the area
Home Values in the Area
Average Home Value in this Area
Purchase History
| Date | Buyer | Sale Price | Title Company |
|---|---|---|---|
| Hall Robert C | $375,000 | None Available | |
| Cornerstone Bank | -- | None Available | |
| Baytree I Llc | $355,000 | None Available |
Source: Public Records
Mortgage History
| Date | Status | Borrower | Loan Amount |
|---|---|---|---|
| Open | Hall Robert C | $300,000 | |
| Previous Owner | Baytree I Llc | $280,000 |
Source: Public Records
Tax History Compared to Growth
Tax History
| Year | Tax Paid | Tax Assessment Tax Assessment Total Assessment is a certain percentage of the fair market value that is determined by local assessors to be the total taxable value of land and additions on the property. | Land | Improvement |
|---|---|---|---|---|
| 2025 | $2,149 | $585,952 | $79,034 | $506,918 |
| 2024 | $2,009 | $382,231 | $103,752 | $278,479 |
| 2023 | $2,045 | $382,231 | $103,752 | $278,479 |
| 2022 | $2,045 | $382,231 | $103,752 | $278,479 |
| 2021 | $0 | $382,231 | $103,752 | $278,479 |
| 2020 | $1,938 | $382,231 | $103,752 | $278,479 |
| 2019 | $1,805 | $375,822 | $77,814 | $298,008 |
| 2017 | $1,815 | $375,822 | $77,814 | $298,008 |
| 2016 | $1,758 | $375,822 | $77,814 | $298,008 |
| 2015 | $1,721 | $375,822 | $77,814 | $298,008 |
| 2014 | $1,510 | $369,080 | $67,790 | $301,290 |
Source: Public Records
Map
Nearby Homes