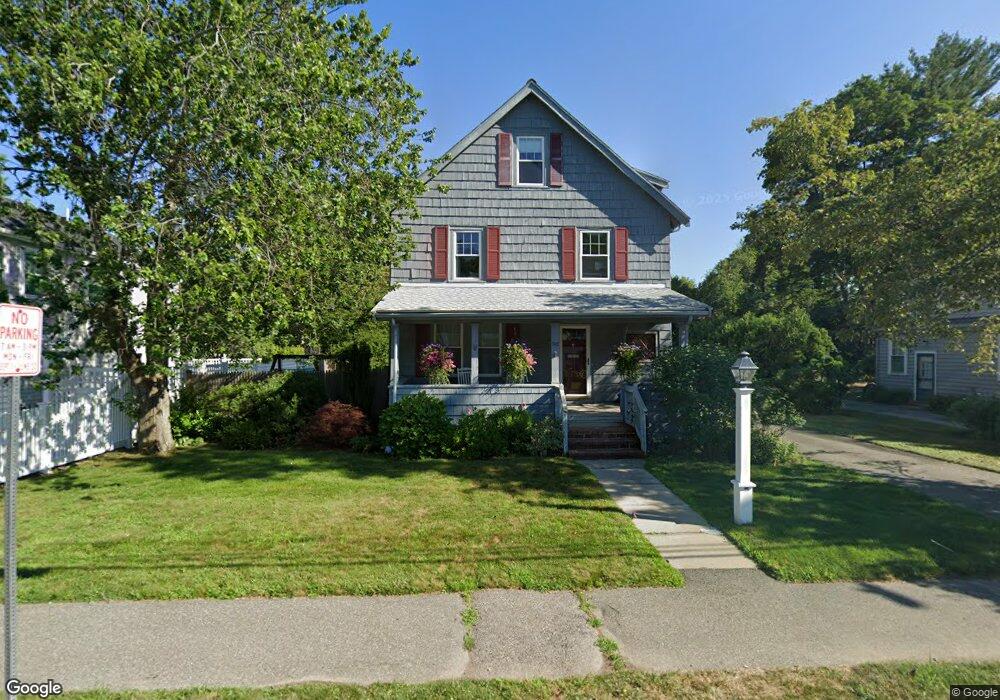
193 Lindbergh Ave Needham Heights, MA 02494
Estimated Value: $1,301,000 - $1,538,000
4
Beds
3
Baths
2,072
Sq Ft
$679/Sq Ft
Est. Value
About This Home
This home is located at 193 Lindbergh Ave, Needham Heights, MA 02494 and is currently estimated at $1,406,509, approximately $678 per square foot. 193 Lindbergh Ave is a home located in Norfolk County with nearby schools including Mitchell Elementary School, High Rock Middle School, and Pollard Middle School.
Ownership History
Date
Name
Owned For
Owner Type
Purchase Details
Closed on
Dec 1, 2014
Sold by
Slawsby Alexander and Veley Kara C
Bought by
Veley Kara C
Current Estimated Value
Home Financials for this Owner
Home Financials are based on the most recent Mortgage that was taken out on this home.
Original Mortgage
$403,000
Outstanding Balance
$309,604
Interest Rate
4%
Mortgage Type
New Conventional
Estimated Equity
$1,096,905
Purchase Details
Closed on
Oct 14, 2008
Sold by
Mcquillan Dorothy E
Bought by
Slawsby Alexander and Veley Kara C
Create a Home Valuation Report for This Property
The Home Valuation Report is an in-depth analysis detailing your home's value as well as a comparison with similar homes in the area
Home Values in the Area
Average Home Value in this Area
Purchase History
| Date | Buyer | Sale Price | Title Company |
|---|---|---|---|
| Veley Kara C | -- | -- | |
| Slawsby Alexander | $591,000 | -- |
Source: Public Records
Mortgage History
| Date | Status | Borrower | Loan Amount |
|---|---|---|---|
| Open | Veley Kara C | $403,000 |
Source: Public Records
Tax History Compared to Growth
Tax History
| Year | Tax Paid | Tax Assessment Tax Assessment Total Assessment is a certain percentage of the fair market value that is determined by local assessors to be the total taxable value of land and additions on the property. | Land | Improvement |
|---|---|---|---|---|
| 2025 | $11,052 | $1,042,600 | $770,500 | $272,100 |
| 2024 | $11,343 | $906,000 | $579,200 | $326,800 |
| 2023 | $11,500 | $881,900 | $579,200 | $302,700 |
| 2022 | $11,066 | $827,700 | $536,300 | $291,400 |
| 2021 | $10,785 | $827,700 | $536,300 | $291,400 |
| 2020 | $10,318 | $826,100 | $536,400 | $289,700 |
| 2019 | $9,551 | $770,900 | $487,600 | $283,300 |
| 2018 | $9,158 | $770,900 | $487,600 | $283,300 |
| 2017 | $8,788 | $739,100 | $487,600 | $251,500 |
| 2016 | $8,529 | $739,100 | $487,600 | $251,500 |
| 2015 | $8,344 | $739,100 | $487,600 | $251,500 |
| 2014 | $7,759 | $666,600 | $424,000 | $242,600 |
Source: Public Records
Map
Nearby Homes
- 556 Webster St
- 190 Brookline St
- 40 Otis St Unit L
- 42 Otis St Unit R
- 445 Hillside Ave
- 62 Washington Ave
- 332 Hillcrest Rd
- 3 Crescent Rd
- 154 Warren St
- 26 Pinewood Rd
- 400 Hunnewell St Unit 103
- 379 Hunnewell St Unit 379
- 71 School St
- 9 Jayne Rd
- 23 Cheney St
- 36 Davenport Rd
- 34 Pershing Rd
- 143 Hunting Rd
- 233 Warren St
- 7 Avery St
- 189 Lindbergh Ave
- 574 Webster St
- 203 Lindbergh Ave
- 42 Lasalle Rd
- 185 Lindbergh Ave
- 568 Webster St
- 36 Lasalle Rd
- 190 Lindbergh Ave
- 52 La Salle Rd
- 202 Lindbergh Ave
- 194 Lindbergh Ave
- 30 Lasalle Rd
- 184 Lindbergh Ave
- 177 Lindbergh Ave
- 562 Webster St
- 594 Webster St
- 24 Lasalle Rd
- 171 Lindbergh Ave
- 573 Webster St
- 573 Webster St Unit NN