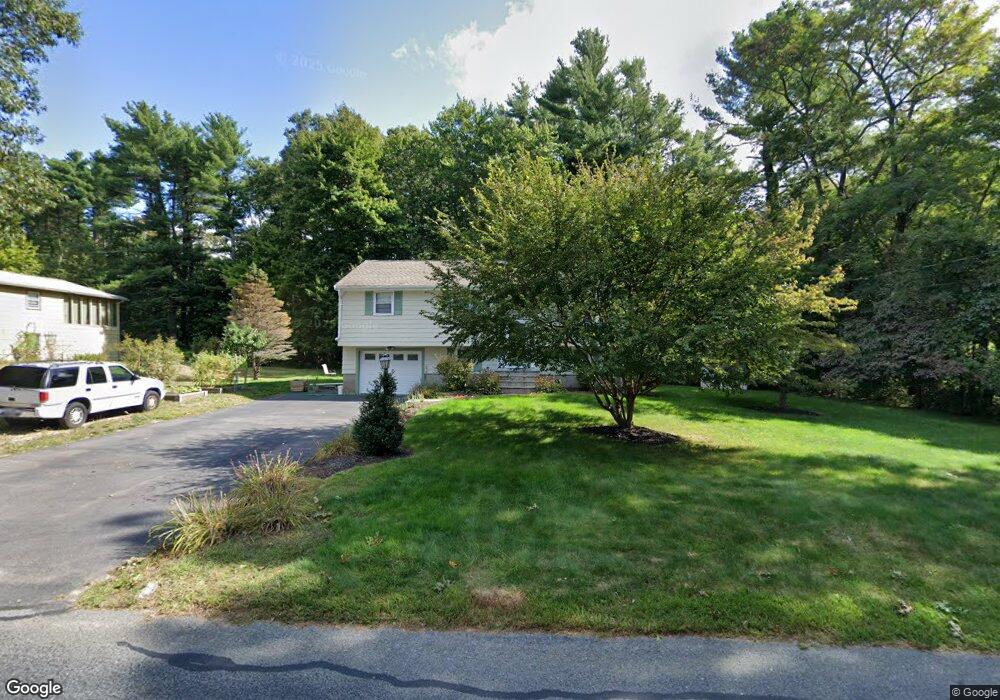
193 Oak St Raynham, MA 02767
Estimated Value: $574,269 - $724,000
3
Beds
2
Baths
1,713
Sq Ft
$363/Sq Ft
Est. Value
About This Home
This home is located at 193 Oak St, Raynham, MA 02767 and is currently estimated at $621,067, approximately $362 per square foot. 193 Oak St is a home located in Bristol County with nearby schools including Merrill Elementary School, LaLiberte Elementary School, and Williams Intermediate School.
Ownership History
Date
Name
Owned For
Owner Type
Purchase Details
Closed on
Jun 25, 1993
Sold by
Wallenmaier Eugene D and Wallenmaier Nancy L
Bought by
Ostiguy Michael E and Ostiguy Jeanine M
Current Estimated Value
Create a Home Valuation Report for This Property
The Home Valuation Report is an in-depth analysis detailing your home's value as well as a comparison with similar homes in the area
Home Values in the Area
Average Home Value in this Area
Purchase History
| Date | Buyer | Sale Price | Title Company |
|---|---|---|---|
| Ostiguy Michael E | $112,700 | -- |
Source: Public Records
Mortgage History
| Date | Status | Borrower | Loan Amount |
|---|---|---|---|
| Open | Ostiguy Michael E | $180,000 | |
| Closed | Ostiguy Michael E | $148,000 | |
| Closed | Ostiguy Michael E | $20,000 | |
| Closed | Ostiguy Michael E | $12,788 |
Source: Public Records
Tax History
| Year | Tax Paid | Tax Assessment Tax Assessment Total Assessment is a certain percentage of the fair market value that is determined by local assessors to be the total taxable value of land and additions on the property. | Land | Improvement |
|---|---|---|---|---|
| 2025 | $6,496 | $536,900 | $224,400 | $312,500 |
| 2024 | $6,420 | $516,900 | $204,400 | $312,500 |
| 2023 | $5,898 | $433,700 | $183,700 | $250,000 |
| 2022 | $5,864 | $395,400 | $173,700 | $221,700 |
| 2021 | $5,540 | $377,100 | $163,700 | $213,400 |
| 2020 | $4,567 | $362,500 | $155,700 | $206,800 |
| 2019 | $5,016 | $352,500 | $145,700 | $206,800 |
| 2018 | $4,613 | $309,600 | $137,700 | $171,900 |
| 2017 | $4,339 | $288,700 | $131,700 | $157,000 |
| 2016 | $4,265 | $284,700 | $127,700 | $157,000 |
| 2015 | $3,897 | $255,700 | $131,800 | $123,900 |
Source: Public Records
Map
Nearby Homes
- 123 Center St
- 658 Broadway
- 646 Broadway
- 314 Britton St
- 634 Broadway
- 138 Carver St
- 2 Maplewood Ln Unit 21-1
- 0 Maplewood Unit 21.3 73426136
- 84 Diniz Dr
- 54 Ann St
- 4-B High Ridge Dr
- 1540 Broadway Unit 35
- 13 Daisy Ave
- 300 Prospect Hill St
- 9 Valley Forge Rd
- 33 White St
- 11 Settlers Rd
- 32 Laurel Ln
- 26 Heritage Dr
- 26 Nottingham Dr
Your Personal Tour Guide
Ask me questions while you tour the home.