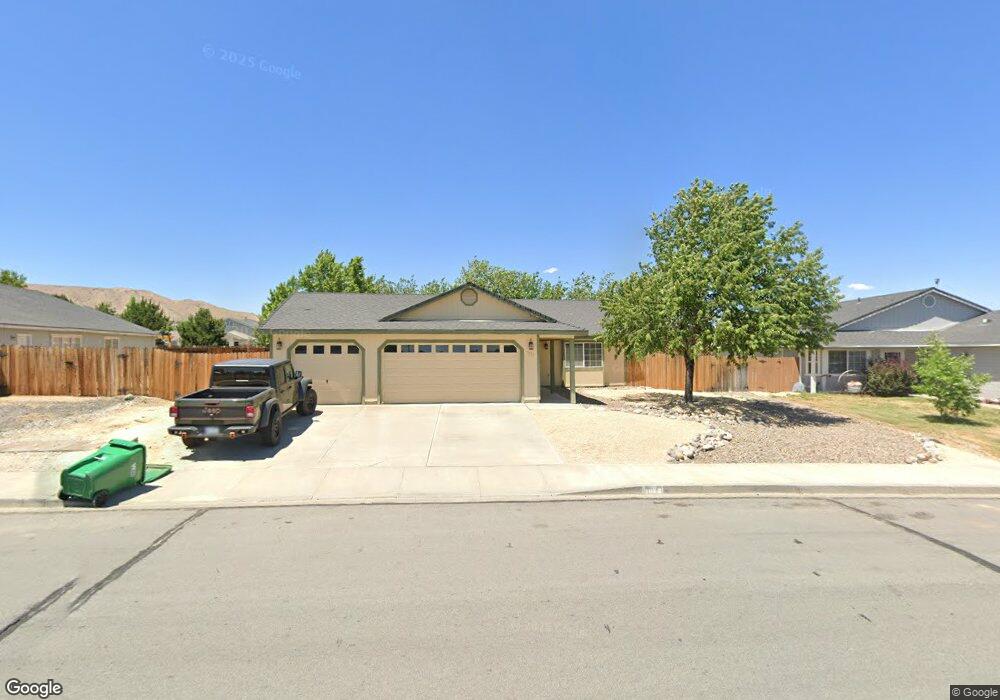
193 Richard Springs Blvd Sparks, NV 89436
Eagle Canyon-Pebble Creek NeighborhoodEstimated Value: $481,000 - $554,000
3
Beds
2
Baths
1,261
Sq Ft
$402/Sq Ft
Est. Value
About This Home
This home is located at 193 Richard Springs Blvd, Sparks, NV 89436 and is currently estimated at $506,539, approximately $401 per square foot. 193 Richard Springs Blvd is a home located in Washoe County with nearby schools including Jesse Hall Elementery School, Yvonne Shaw Middle School, and Spanish Springs High School.
Ownership History
Date
Name
Owned For
Owner Type
Purchase Details
Closed on
Mar 26, 2021
Sold by
Muscato Erica M
Bought by
Muscato Erica M
Current Estimated Value
Home Financials for this Owner
Home Financials are based on the most recent Mortgage that was taken out on this home.
Original Mortgage
$218,000
Outstanding Balance
$196,189
Interest Rate
2.8%
Mortgage Type
New Conventional
Estimated Equity
$310,350
Purchase Details
Closed on
Jan 18, 2017
Sold by
Muscato Erica M
Bought by
Muscato Erica M
Purchase Details
Closed on
Mar 12, 2010
Sold by
Muscato David S
Bought by
Muscato Erica M
Purchase Details
Closed on
Feb 9, 1998
Sold by
North Springs Estates Ltd
Bought by
Muscato David S and Muscato Erica M
Home Financials for this Owner
Home Financials are based on the most recent Mortgage that was taken out on this home.
Original Mortgage
$135,072
Interest Rate
6.95%
Mortgage Type
FHA
Create a Home Valuation Report for This Property
The Home Valuation Report is an in-depth analysis detailing your home's value as well as a comparison with similar homes in the area
Home Values in the Area
Average Home Value in this Area
Purchase History
| Date | Buyer | Sale Price | Title Company |
|---|---|---|---|
| Muscato Erica M | -- | First American Title Sparks | |
| Muscato Erica M | -- | First American Title Ins Co | |
| Muscato Erica M | -- | None Available | |
| Muscato David S | $137,000 | First Centennial Title Co |
Source: Public Records
Mortgage History
| Date | Status | Borrower | Loan Amount |
|---|---|---|---|
| Open | Muscato Erica M | $218,000 | |
| Closed | Muscato David S | $135,072 |
Source: Public Records
Tax History Compared to Growth
Tax History
| Year | Tax Paid | Tax Assessment Tax Assessment Total Assessment is a certain percentage of the fair market value that is determined by local assessors to be the total taxable value of land and additions on the property. | Land | Improvement |
|---|---|---|---|---|
| 2025 | $1,817 | $91,660 | $37,835 | $53,825 |
| 2024 | $1,817 | $88,959 | $34,580 | $54,379 |
| 2023 | $1,696 | $84,774 | $35,385 | $49,389 |
| 2022 | $1,648 | $70,011 | $28,700 | $41,311 |
| 2021 | $1,601 | $65,136 | $23,940 | $41,196 |
| 2020 | $1,552 | $64,915 | $23,555 | $41,360 |
| 2019 | $1,507 | $63,552 | $23,590 | $39,962 |
| 2018 | $1,465 | $54,937 | $15,750 | $39,187 |
| 2017 | $1,422 | $55,053 | $15,750 | $39,303 |
| 2016 | $1,385 | $53,641 | $13,440 | $40,201 |
| 2015 | $1,384 | $53,619 | $13,370 | $40,249 |
| 2014 | $1,344 | $48,258 | $9,380 | $38,878 |
| 2013 | -- | $39,981 | $7,350 | $32,631 |
Source: Public Records
Map
Nearby Homes
- 256 Tankersley Dr
- 160 Ember Dr
- 2755 Falcon View Ct
- 30 Horse Springs Dr
- 195 Monumental Cir
- 20 Tankersley Ct
- 170 Veronica Ave
- 195 Mia Dr
- 15 N Patterson Place
- 35 N Tropicana Cir
- 42 S Amanda Cir
- 30 N Patterson Place
- 50 N Spring Mountain Cir
- 335 Veronica Ave
- 7405 Robert Banks Blvd
- 284 Arlis Place
- 282 Arlis Place
- The Vineyard Plan at Silverado Village
- The Nantucket Plan at Silverado Village
- The Newport Plan at Silverado Village
- 195 Richard Springs Blvd
- 191 Richard Springs Blvd
- 284 Bartmess Blvd
- 288 Bartmess Blvd
- 189 Richard Springs Blvd
- 280 Bartmess Blvd
- 6468 Adobe Springs Dr
- 6464 Adobe Springs Dr
- 268 Bartmess Blvd
- 6460 Adobe Springs Dr
- 187 Richard Springs Blvd
- 264 Bartmess Blvd
- 6450 Adobe Springs Dr
- 185 Richard Springs Blvd
- 287 Bartmess Blvd
- 283 Bartmess Blvd
- 291 Bartmess Blvd
- 279 Bartmess Blvd
- 260 Bartmess Blvd
- 275 Bartmess Blvd