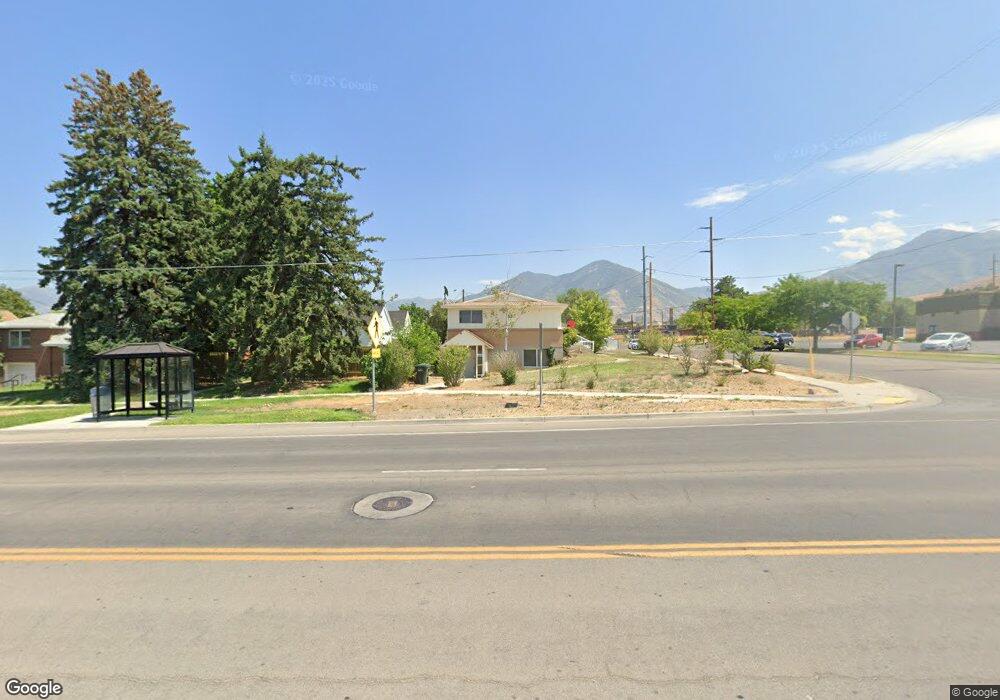
193 S Main St Tooele, UT 84074
Estimated Value: $235,000 - $402,000
3
Beds
3
Baths
2,880
Sq Ft
$112/Sq Ft
Est. Value
About This Home
This home is located at 193 S Main St, Tooele, UT 84074 and is currently estimated at $323,649, approximately $112 per square foot. 193 S Main St is a home located in Tooele County with nearby schools including Sterling Elementary School, Tooele Junior High School, and Tooele High School.
Ownership History
Date
Name
Owned For
Owner Type
Purchase Details
Closed on
Dec 17, 2021
Sold by
Atkin Gordon Scott and The Atkin Living Trust
Bought by
Allen Zachary T
Current Estimated Value
Home Financials for this Owner
Home Financials are based on the most recent Mortgage that was taken out on this home.
Original Mortgage
$310,400
Outstanding Balance
$285,410
Interest Rate
3.09%
Mortgage Type
New Conventional
Estimated Equity
$38,239
Purchase Details
Closed on
Sep 28, 2018
Sold by
Atkin Jerron R and Atkin Linda V
Bought by
Atkin Jerron Robert and Atkin Linda Rene
Create a Home Valuation Report for This Property
The Home Valuation Report is an in-depth analysis detailing your home's value as well as a comparison with similar homes in the area
Purchase History
We collect this data history from publicly available records. To have your information removed, we recommend requesting removal directly through your county’s website.
| Date | Buyer | Sale Price | Title Company |
|---|---|---|---|
| Allen Zachary T | -- | Us Title Insurance Agency | |
| Atkin Jerron Robert | -- | Tooele Title Company |
Source: Public Records
Mortgage History
We collect this data history from publicly available records. To have your information removed, we recommend requesting removal directly through your county’s website.
| Date | Status | Borrower | Loan Amount |
|---|---|---|---|
| Open | Allen Zachary T | $310,400 |
Source: Public Records
Tax History
| Year | Tax Paid | Tax Assessment Tax Assessment Total Assessment is a certain percentage of the fair market value that is determined by local assessors to be the total taxable value of land and additions on the property. | Land | Improvement |
|---|---|---|---|---|
| 2025 | $1,909 | $289,534 | $67,850 | $221,684 |
| 2024 | $2,125 | $162,230 | $37,318 | $124,912 |
| 2023 | $2,125 | $150,093 | $35,530 | $114,563 |
| 2022 | $2,128 | $183,076 | $41,525 | $141,551 |
| 2021 | $1,324 | $95,250 | $16,610 | $78,640 |
| 2020 | $1,265 | $157,862 | $30,200 | $127,662 |
| 2019 | $1,150 | $141,210 | $30,200 | $111,010 |
| 2018 | $1,077 | $125,392 | $40,000 | $85,392 |
| 2017 | $869 | $119,123 | $35,625 | $83,498 |
| 2016 | $827 | $60,135 | $19,594 | $40,541 |
| 2015 | $827 | $60,135 | $0 | $0 |
| 2014 | -- | $60,135 | $0 | $0 |
Source: Public Records
Map
Nearby Homes
Your Personal Tour Guide
Ask me questions while you tour the home.