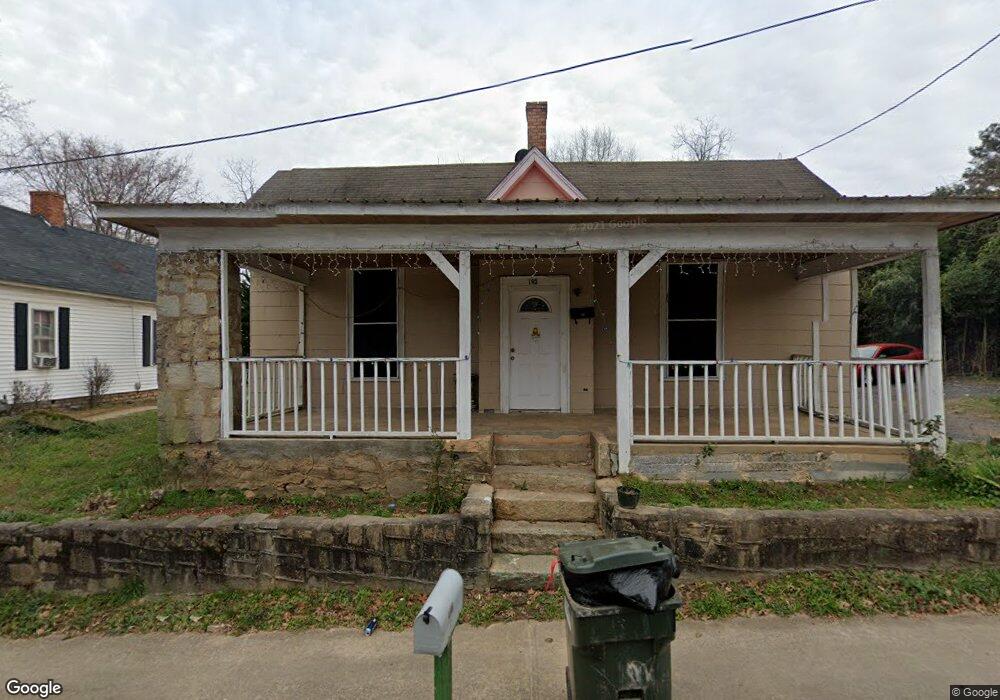
193 S Oliver St Elberton, GA 30635
Estimated Value: $55,908 - $121,000
3
Beds
1
Bath
1,604
Sq Ft
$50/Sq Ft
Est. Value
About This Home
This home is located at 193 S Oliver St, Elberton, GA 30635 and is currently estimated at $80,727, approximately $50 per square foot. 193 S Oliver St is a home located in Elbert County with nearby schools including Elbert County Primary School, Elbert County Elementary School, and Elbert County Middle School.
Ownership History
Date
Name
Owned For
Owner Type
Purchase Details
Closed on
Aug 26, 2013
Sold by
Poole Robert
Bought by
Perez Aracely and Hernandez Miguel Angel
Current Estimated Value
Home Financials for this Owner
Home Financials are based on the most recent Mortgage that was taken out on this home.
Original Mortgage
$8,000
Interest Rate
4.31%
Purchase Details
Closed on
Aug 1, 2011
Sold by
Bradford Larry H
Bought by
Poole Robert
Purchase Details
Closed on
Feb 12, 2007
Sold by
Trio Red Properties Lllp
Bought by
Bradford Larry H
Purchase Details
Closed on
Dec 14, 2005
Sold by
Webb Mary Jean Brady
Bought by
Trio Red Properties Lllp
Purchase Details
Closed on
Jul 19, 2004
Sold by
Est Of Ophelia B Maxwell 0
Bought by
Webb Mary Jean Brady
Purchase Details
Closed on
Aug 1, 1972
Purchase Details
Closed on
Mar 1, 1970
Purchase Details
Closed on
Oct 1, 1967
Purchase Details
Closed on
Feb 1, 1965
Create a Home Valuation Report for This Property
The Home Valuation Report is an in-depth analysis detailing your home's value as well as a comparison with similar homes in the area
Home Values in the Area
Average Home Value in this Area
Purchase History
| Date | Buyer | Sale Price | Title Company |
|---|---|---|---|
| Perez Aracely | $8,500 | -- | |
| Poole Robert | -- | -- | |
| Bradford Larry H | $25,000 | -- | |
| Trio Red Properties Lllp | $57,200 | -- | |
| Webb Mary Jean Brady | -- | -- | |
| -- | -- | -- | |
| -- | $8,500 | -- | |
| -- | $2,200 | -- | |
| -- | -- | -- |
Source: Public Records
Mortgage History
| Date | Status | Borrower | Loan Amount |
|---|---|---|---|
| Closed | Perez Aracely | $8,000 |
Source: Public Records
Tax History Compared to Growth
Tax History
| Year | Tax Paid | Tax Assessment Tax Assessment Total Assessment is a certain percentage of the fair market value that is determined by local assessors to be the total taxable value of land and additions on the property. | Land | Improvement |
|---|---|---|---|---|
| 2024 | $156 | $6,355 | $2,319 | $4,036 |
| 2023 | $156 | $6,355 | $2,319 | $4,036 |
| 2022 | $144 | $5,872 | $2,319 | $3,553 |
| 2021 | $146 | $5,872 | $2,319 | $3,553 |
| 2020 | $132 | $4,800 | $2,319 | $2,481 |
| 2019 | $137 | $4,800 | $2,319 | $2,481 |
| 2018 | $140 | $4,800 | $2,319 | $2,481 |
| 2017 | $129 | $4,117 | $2,319 | $1,798 |
| 2016 | $121 | $4,117 | $2,319 | $1,798 |
| 2015 | -- | $4,117 | $2,319 | $1,798 |
| 2014 | -- | $4,117 | $2,319 | $1,798 |
| 2013 | -- | $5,402 | $2,319 | $3,083 |
Source: Public Records
Map
Nearby Homes
- 196 S Oliver St
- 2790 Cedar Creek Rd
- 0 Oak Dr Unit 7643600
- 0 Oak Dr Unit 10598083
- 105 S Thomas St
- 118 Oak Dr
- 62 Oak St
- 245 Edwards St
- 252 Edwards St
- 108 Brookhaven Cir
- 120 S Tusten St
- 968 Ext Elbert St
- 415 Athenia St
- 136 Forest Ave
- 143 Lake Forest Cir
- 170 Lake Forest Dr
- 89 College Ave
- 135 Brookside Dr
- 270 Dogwood Ln
- 181 Brookside Dr
- 187 S Oliver St
- 183 S Oliver St
- 198 S Mcintosh St
- 190 S Mcintosh St
- 190 S Oliver St
- 182 S Oliver St
- 181 S Oliver St
- 186 S Mcintosh St
- 200 S Oliver St
- 180 S Mcintosh St
- 179 S Oliver St
- 170 S Oliver St
- 206 S Oliver St
- 206 S Mcintosh St
- 174 S Mcintosh St
- 174B S Mcintosh St
- 214 S Mcintosh St
- 165 S Oliver St
- 174 S Mcintosh St
- 168 S Oliver St