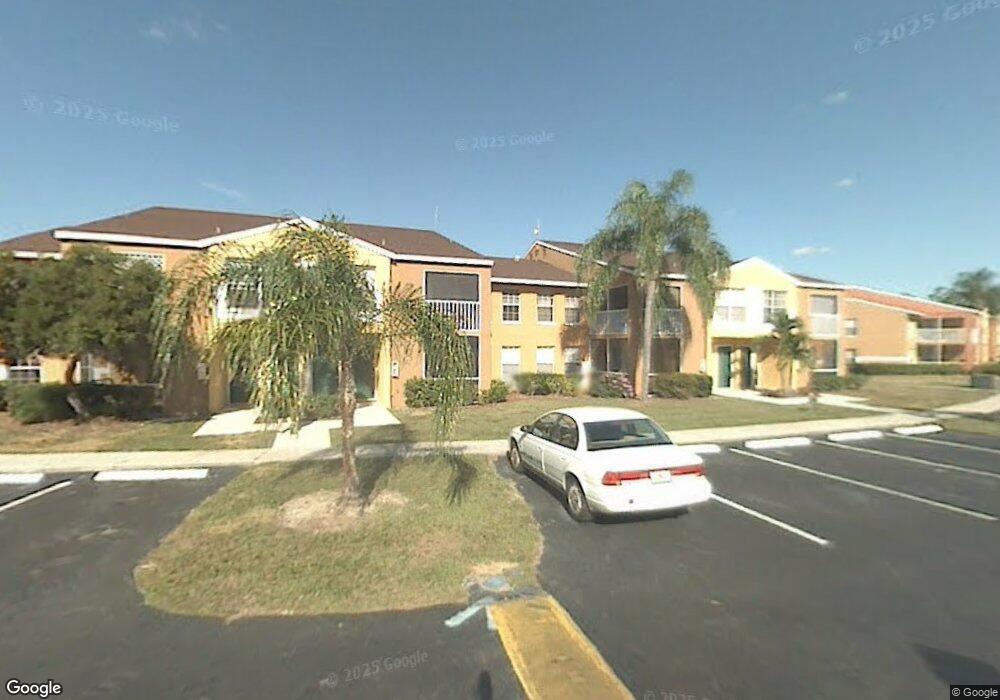
193 Santa Clara Dr Unit 11 Naples, FL 34104
East Naples NeighborhoodEstimated Value: $182,000 - $270,000
--
Bed
--
Bath
725
Sq Ft
$288/Sq Ft
Est. Value
About This Home
This home is located at 193 Santa Clara Dr Unit 11, Naples, FL 34104 and is currently estimated at $209,147, approximately $288 per square foot. 193 Santa Clara Dr Unit 11 is a home located in Collier County with nearby schools including Golden Gate High School, Calusa Park Elementary School, and East Naples Middle School.
Ownership History
Date
Name
Owned For
Owner Type
Purchase Details
Closed on
Apr 6, 2016
Sold by
Songbird Capital Llc
Bought by
Borda Eliana
Current Estimated Value
Purchase Details
Closed on
Aug 4, 2015
Sold by
Jpmorgan Chase Bank National Association
Bought by
Songbird Capital Llc
Purchase Details
Closed on
Dec 19, 2014
Sold by
Martinez Ciro
Bought by
Jpmorgan Chase Bank National Association
Purchase Details
Closed on
Sep 4, 2008
Sold by
Metro Dade Investments Co
Bought by
Martinez Ciro
Home Financials for this Owner
Home Financials are based on the most recent Mortgage that was taken out on this home.
Original Mortgage
$125,250
Interest Rate
6.48%
Mortgage Type
Purchase Money Mortgage
Purchase Details
Closed on
Jan 4, 2007
Sold by
Santa Barbara Garden Villas Llc
Bought by
Metro Dade Investments Co
Create a Home Valuation Report for This Property
The Home Valuation Report is an in-depth analysis detailing your home's value as well as a comparison with similar homes in the area
Home Values in the Area
Average Home Value in this Area
Purchase History
| Date | Buyer | Sale Price | Title Company |
|---|---|---|---|
| Borda Eliana | $65,000 | None Available | |
| Songbird Capital Llc | $38,500 | Fidelity Natl Title Fl Inc | |
| Jpmorgan Chase Bank National Association | $1,000 | None Available | |
| Martinez Ciro | $167,000 | Metro Dade Title Co | |
| Metro Dade Investments Co | -- | Metro Dade Title Co |
Source: Public Records
Mortgage History
| Date | Status | Borrower | Loan Amount |
|---|---|---|---|
| Previous Owner | Martinez Ciro | $125,250 |
Source: Public Records
Tax History Compared to Growth
Tax History
| Year | Tax Paid | Tax Assessment Tax Assessment Total Assessment is a certain percentage of the fair market value that is determined by local assessors to be the total taxable value of land and additions on the property. | Land | Improvement |
|---|---|---|---|---|
| 2025 | $1,201 | $176,750 | -- | $176,750 |
| 2024 | $1,178 | $156,560 | -- | -- |
| 2023 | $1,178 | $152,000 | $0 | $152,000 |
| 2022 | $1,328 | $107,771 | $0 | $0 |
| 2021 | $1,141 | $97,974 | $0 | $0 |
| 2020 | $1,046 | $89,067 | $0 | $0 |
| 2019 | $937 | $80,970 | $0 | $80,970 |
| 2018 | $436 | $76,805 | $0 | $76,805 |
| 2017 | $865 | $74,306 | $0 | $74,306 |
| 2016 | $752 | $64,310 | $0 | $0 |
| 2015 | $640 | $51,815 | $0 | $0 |
| 2014 | $463 | $35,922 | $0 | $0 |
Source: Public Records
Map
Nearby Homes
- 201 Santa Clara Dr Unit 201
- 169 Santa Clara Dr Unit 11
- 188 Furse Lakes Cir Unit 3
- 142 Santa Clara Dr Unit 7
- 192 Furse Lakes Cir Unit 11
- 169 Plantation Cir
- 208 Furse Lakes Cir Unit D6
- 196 Furse Lakes Cir Unit 6
- 7360 Glenmoor Ln Unit 4301
- 124 Santa Clara Dr
- 7340 Glenmoor Ln Unit 3108
- 7360 Saint Ives Way Unit 2103
- 146 Plantation Cir
- 193 Santa Clara Dr Unit 10
- 193 Santa Clara Dr Unit 193 SANTA CLARA DR
- 193 Santa Clara Dr Unit 193 Santa Clara DR13
- 193 Santa Clara Dr Unit 13
- 193 Santa Clara Dr Unit 193 Santa Clara DR14
- 193 Santa Clara Dr Unit 193-6
- 193 Santa Clara Dr Unit 193-5
- 193 Santa Clara Dr Unit 193-7
- 193 Santa Clara Dr Unit 8
- 193 Santa Clara Dr Unit 7
- 193 Santa Clara Dr Unit 6
- 193 Santa Clara Dr
- 193 Santa Clara Dr Unit 4
- 193 Santa Clara Dr Unit 2
- 193 Santa Clara Dr
- 193 Santa Clara Dr Unit 15
- 193 Santa Clara Dr Unit 12
- 193 Santa Clara Dr Unit 14
- 201 Santa Clara Dr Unit 7