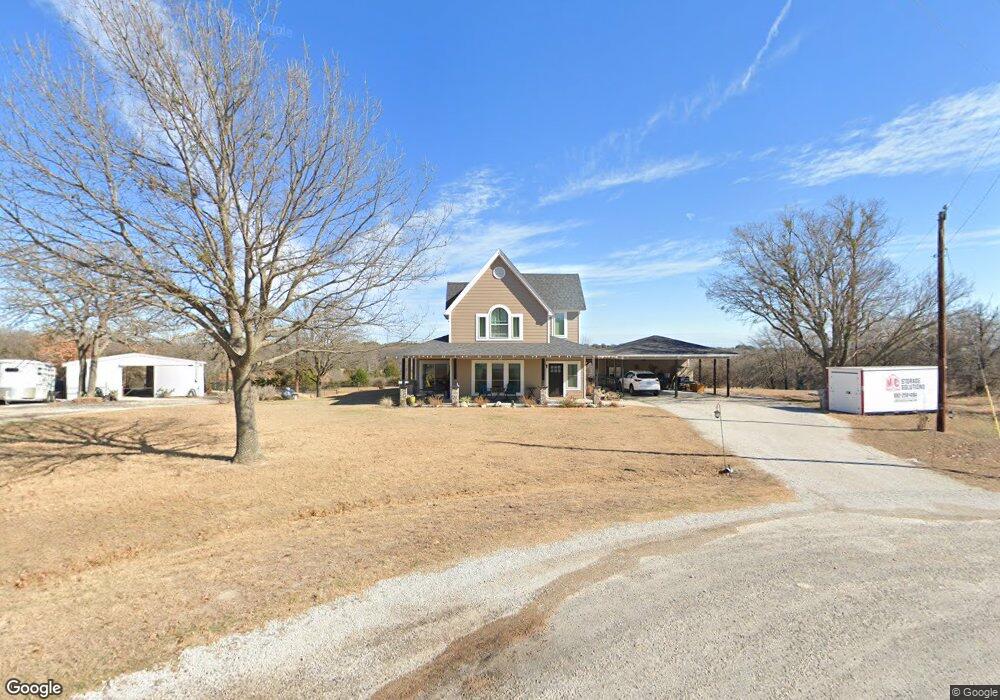
193 Shady Grove Ln Weatherford, TX 76088
Estimated Value: $441,000 - $547,000
--
Bed
--
Bath
1,480
Sq Ft
$322/Sq Ft
Est. Value
About This Home
This home is located at 193 Shady Grove Ln, Weatherford, TX 76088 and is currently estimated at $477,108, approximately $322 per square foot. 193 Shady Grove Ln is a home located in Parker County with nearby schools including Peaster Elementary School, Peaster Middle School, and Peaster High School.
Ownership History
Date
Name
Owned For
Owner Type
Purchase Details
Closed on
Jun 17, 2022
Sold by
Joseph Schwartz Thomas
Bought by
Schwartz Thomas Jospeh and Parish Lesa Jane
Current Estimated Value
Purchase Details
Closed on
Jul 14, 2021
Sold by
Firmin Madison Joseph
Bought by
Parish Lesa Jane
Purchase Details
Closed on
Jun 6, 2017
Sold by
Schwartz Thomas Joseph
Bought by
Schwartz Thomas Joseph
Purchase Details
Closed on
May 22, 1998
Bought by
Schwartz Thomas Joseph
Purchase Details
Closed on
Nov 15, 1997
Bought by
Schwartz Thomas Joseph
Purchase Details
Closed on
Mar 1, 1996
Bought by
Schwartz Thomas Joseph
Purchase Details
Closed on
Jan 21, 1992
Bought by
Schwartz Thomas Joseph
Purchase Details
Closed on
Jan 1, 1901
Bought by
Schwartz Thomas Joseph
Create a Home Valuation Report for This Property
The Home Valuation Report is an in-depth analysis detailing your home's value as well as a comparison with similar homes in the area
Home Values in the Area
Average Home Value in this Area
Purchase History
| Date | Buyer | Sale Price | Title Company |
|---|---|---|---|
| Schwartz Thomas Jospeh | -- | None Listed On Document | |
| Parish Lesa Jane | -- | None Listed On Document | |
| Schwartz Thomas Joseph | -- | None Available | |
| Schwartz Thomas Joseph | -- | -- | |
| Schwartz Thomas Joseph | -- | -- | |
| Schwartz Thomas Joseph | -- | -- | |
| Schwartz Thomas Joseph | -- | -- | |
| Schwartz Thomas Joseph | -- | -- |
Source: Public Records
Tax History Compared to Growth
Tax History
| Year | Tax Paid | Tax Assessment Tax Assessment Total Assessment is a certain percentage of the fair market value that is determined by local assessors to be the total taxable value of land and additions on the property. | Land | Improvement |
|---|---|---|---|---|
| 2025 | $5,627 | $489,457 | -- | -- |
| 2024 | $5,627 | $444,961 | -- | -- |
| 2023 | $5,627 | $404,510 | $0 | $0 |
| 2022 | $7,335 | $379,100 | $153,390 | $225,710 |
| 2021 | $6,721 | $366,700 | $153,390 | $213,310 |
| 2020 | $6,233 | $327,380 | $92,880 | $234,500 |
| 2019 | $5,953 | $327,380 | $92,880 | $234,500 |
| 2018 | $5,428 | $251,170 | $70,760 | $180,410 |
| 2017 | $5,402 | $251,170 | $70,760 | $180,410 |
| 2016 | $5,183 | $241,020 | $64,640 | $176,380 |
| 2015 | $4,281 | $241,020 | $64,640 | $176,380 |
| 2014 | $4,037 | $203,140 | $64,640 | $138,500 |
Source: Public Records
Map
Nearby Homes
- 111 Sharla Smelley Rd
- 300 Constitution Ct
- 341 Sharla Smelley Rd
- TBD Fm 920 Peaster Hwy
- 4320 Fm 920
- Brazos Plan at Freeman Ranch
- Longhorn Plan at Freeman Ranch
- Colorado Plan at Freeman Ranch
- 4200 Fm 920
- 1001 Salvation
- 3024 Truth Ct
- 1009 Salvation Dr
- 1057 Salvation Dr
- 1017 Salvation Dr
- 153 Star Point Ln
- 100 Rio Bravo Ct
- 2097 Redemption Dr
- 2068 Redemption Dr
- 950 Johnson Bend Rd
- 109 Rio Bravo Ct
- 181 Shady Grove Ln
- 162 Shady Grove Ln
- 165 Shady Grove Ln
- 198 Shady Grove Ln
- 144 Shady Grove Ln
- 199 Shady Grove Ln
- 143 Shady Grove Ln
- 104 Shady Grove Ln
- 111 Shady Grove Ln
- 1632 Shady Grove Rd
- 1590 Shady Grove Rd
- 1534 Shady Grove Rd
- 1490 Shady Grove Rd
- 1780 Shady Grove Rd
- 000000 Shady Grove Rd
- TBD Shady Grove Rd
- 003 Shady Grove Rd
- 002 Shady Grove Rd
- 001 Shady Grove Rd
- 1800 Shady Grove Rd