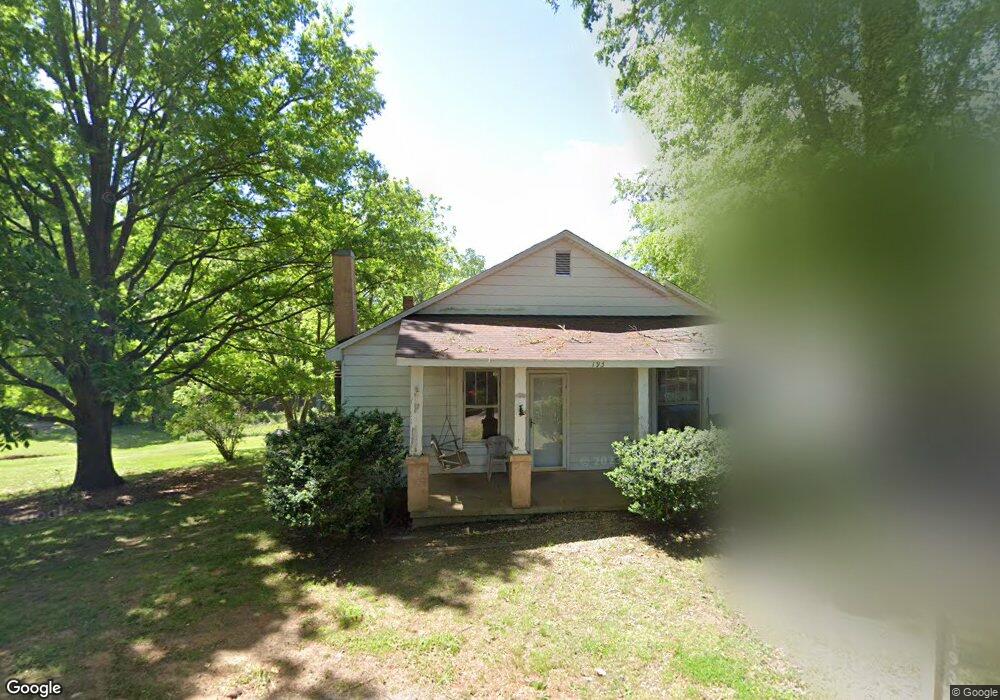
193 Thomas St Troutman, NC 28166
Estimated Value: $173,000 - $263,000
3
Beds
1
Bath
1,316
Sq Ft
$159/Sq Ft
Est. Value
About This Home
This home is located at 193 Thomas St, Troutman, NC 28166 and is currently estimated at $209,277, approximately $159 per square foot. 193 Thomas St is a home located in Iredell County with nearby schools including Troutman Elementary School, Troutman Middle School, and South Iredell High School.
Ownership History
Date
Name
Owned For
Owner Type
Purchase Details
Closed on
Sep 28, 2001
Sold by
Harrington Donald C and Harrington Linda P
Bought by
Nance Glenda Ann
Current Estimated Value
Home Financials for this Owner
Home Financials are based on the most recent Mortgage that was taken out on this home.
Original Mortgage
$56,000
Outstanding Balance
$21,920
Interest Rate
6.89%
Estimated Equity
$187,357
Purchase Details
Closed on
Jun 1, 1955
Create a Home Valuation Report for This Property
The Home Valuation Report is an in-depth analysis detailing your home's value as well as a comparison with similar homes in the area
Home Values in the Area
Average Home Value in this Area
Purchase History
| Date | Buyer | Sale Price | Title Company |
|---|---|---|---|
| Nance Glenda Ann | $60,000 | -- | |
| -- | -- | -- |
Source: Public Records
Mortgage History
| Date | Status | Borrower | Loan Amount |
|---|---|---|---|
| Open | Nance Glenda Ann | $56,000 |
Source: Public Records
Tax History Compared to Growth
Tax History
| Year | Tax Paid | Tax Assessment Tax Assessment Total Assessment is a certain percentage of the fair market value that is determined by local assessors to be the total taxable value of land and additions on the property. | Land | Improvement |
|---|---|---|---|---|
| 2024 | $1,177 | $101,520 | $40,000 | $61,520 |
| 2023 | $1,177 | $101,520 | $40,000 | $61,520 |
| 2022 | $722 | $57,160 | $15,000 | $42,160 |
| 2021 | $712 | $57,160 | $15,000 | $42,160 |
| 2020 | $712 | $57,160 | $15,000 | $42,160 |
| 2019 | $698 | $57,160 | $15,000 | $42,160 |
| 2018 | $644 | $52,930 | $14,000 | $38,930 |
| 2017 | $644 | $52,930 | $14,000 | $38,930 |
| 2016 | $644 | $52,930 | $14,000 | $38,930 |
| 2015 | $617 | $52,930 | $14,000 | $38,930 |
| 2014 | $617 | $55,390 | $13,000 | $42,390 |
Source: Public Records
Map
Nearby Homes