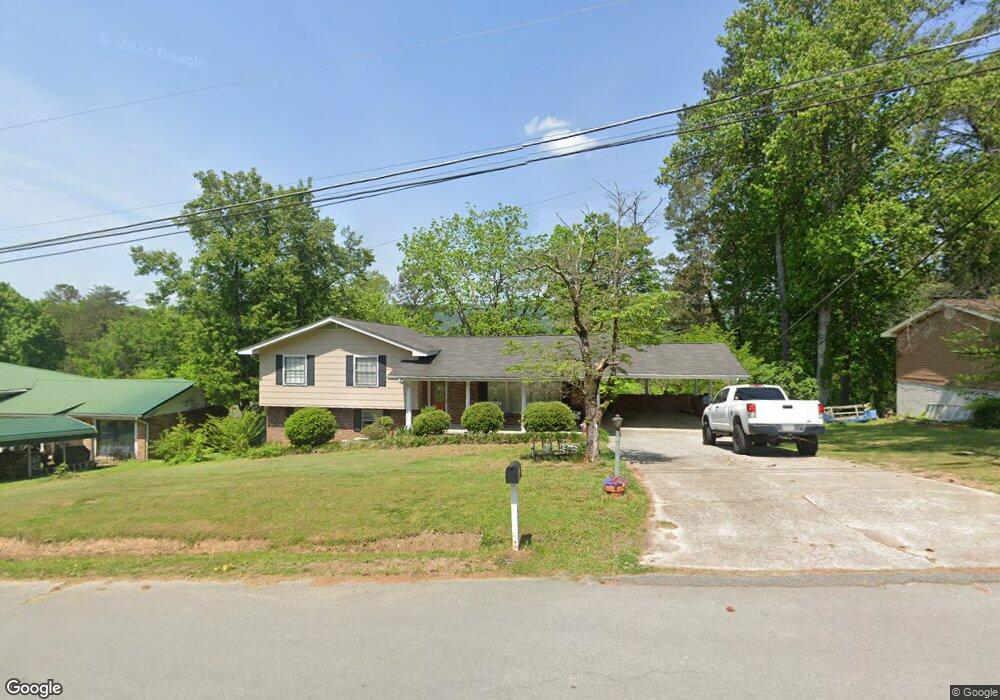
193 Tinker Bell Cir Flintstone, GA 30725
Flintstone NeighborhoodEstimated Value: $223,059 - $354,000
3
Beds
3
Baths
1,889
Sq Ft
$143/Sq Ft
Est. Value
About This Home
This home is located at 193 Tinker Bell Cir, Flintstone, GA 30725 and is currently estimated at $269,265, approximately $142 per square foot. 193 Tinker Bell Cir is a home located in Walker County with nearby schools including Chattanooga Valley Elementary School, Chattanooga Valley Middle School, and Ridgeland High School.
Ownership History
Date
Name
Owned For
Owner Type
Purchase Details
Closed on
May 12, 2005
Sold by
Houston Jerrold M
Bought by
Jones Scott C and Jones Jessica C
Current Estimated Value
Purchase Details
Closed on
May 10, 2005
Sold by
Not Provided
Bought by
Jones Scott C and Jones Jessica C
Purchase Details
Closed on
Dec 26, 2001
Sold by
Houston Jerrold M
Bought by
Houston Jerrold M David P
Purchase Details
Closed on
Aug 28, 2001
Sold by
Houston Jerrold M and Houston Barbara S
Bought by
Houston Jerrold M
Purchase Details
Closed on
Jun 29, 2000
Sold by
Durham William S and Durham Donna
Bought by
Houston Jerrold M and Houston Barbara S
Purchase Details
Closed on
Oct 27, 1987
Sold by
Cornell Nelda J
Bought by
Durham William S and Durham Donna
Purchase Details
Closed on
Sep 21, 1983
Sold by
Cornell Jay E
Bought by
Cornell Nelda J
Purchase Details
Closed on
Jan 1, 1964
Bought by
Cornell Jay E
Create a Home Valuation Report for This Property
The Home Valuation Report is an in-depth analysis detailing your home's value as well as a comparison with similar homes in the area
Home Values in the Area
Average Home Value in this Area
Purchase History
| Date | Buyer | Sale Price | Title Company |
|---|---|---|---|
| Jones Scott C | $108,875 | -- | |
| Jones Scott C | -- | -- | |
| Houston Jerrold M David P | -- | -- | |
| Houston Jerrold M | -- | -- | |
| Houston Jerrold M | $87,000 | -- | |
| Durham William S | $51,000 | -- | |
| Cornell Nelda J | -- | -- | |
| Cornell Jay E | -- | -- |
Source: Public Records
Tax History Compared to Growth
Tax History
| Year | Tax Paid | Tax Assessment Tax Assessment Total Assessment is a certain percentage of the fair market value that is determined by local assessors to be the total taxable value of land and additions on the property. | Land | Improvement |
|---|---|---|---|---|
| 2024 | $1,533 | $66,680 | $6,221 | $60,459 |
| 2023 | $1,496 | $63,595 | $6,221 | $57,374 |
| 2022 | $1,366 | $53,266 | $3,456 | $49,810 |
| 2021 | $1,113 | $38,302 | $3,456 | $34,846 |
| 2020 | $1,039 | $34,142 | $3,456 | $30,686 |
| 2019 | $1,057 | $34,169 | $3,456 | $30,713 |
| 2018 | $904 | $34,169 | $3,456 | $30,713 |
| 2017 | $1,151 | $34,169 | $3,456 | $30,713 |
| 2016 | $966 | $34,169 | $3,456 | $30,713 |
| 2015 | $986 | $32,863 | $3,816 | $29,047 |
| 2014 | $894 | $32,863 | $3,816 | $29,047 |
| 2013 | -- | $32,863 | $3,816 | $29,047 |
Source: Public Records
Map
Nearby Homes
- 569 Tinker Bell Cir
- 184 Cinderella Dr
- 4302 Happy Valley Rd
- 113 Fox Run Cir N
- 137 Fox Run Cir N
- 4766 Happy Valley Rd
- 76 Saddlebred Way
- 114 Saddlebred Way
- 18 Buck Creek Ln
- 278 Dry Valley Rd
- 306 Dry Valley Rd
- 880 Dry Valley Rd
- 2937 Happy Valley Rd
- 297 Draft St
- 307 Draft St
- 313 Draft St
- 0 Dry Valley Rd Unit 1507680
- 259 Draft St
- 346 Draft St
- 34 And 38 East Ave
- 171 Tinker Bell Cir
- 205 Tinker Bell Cir
- 159 Tinker Bell Cir
- 229 Tinker Bell Cir
- 326 Burnt Mill Ln
- 214 Tinker Bell Cir
- 192 Tinker Bell Cir
- 284 Burnt Mill Ln
- 292 Burnt Mill Ln
- 172 Tinker Bell Cir
- 141 Tinker Bell Cir
- 243 Tinker Bell Cir
- 154 Tinker Bell Cir
- 234 Tinker Bell Cir
- 338 Burnt Mill Ln
- Lot 11 Burnt Mill Ln
- Lot 11 Burnt Mill Ln Unit 11
- 107 Cinderella Dr
- 134 Tinker Bell Cir
- 398 Burnt Mill Ln