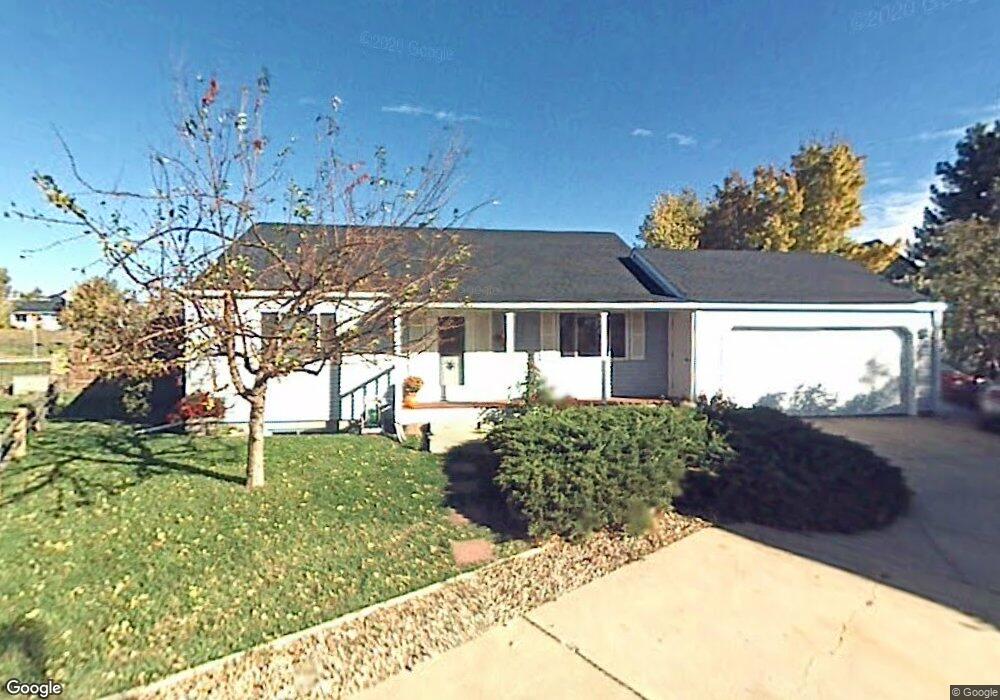
193 W Elm St Louisville, CO 80027
Estimated Value: $731,212 - $834,000
4
Beds
2
Baths
2,016
Sq Ft
$384/Sq Ft
Est. Value
About This Home
This home is located at 193 W Elm St, Louisville, CO 80027 and is currently estimated at $774,803, approximately $384 per square foot. 193 W Elm St is a home located in Boulder County with nearby schools including Louisville Elementary School, Louisville Middle School, and Monarch High School.
Ownership History
Date
Name
Owned For
Owner Type
Purchase Details
Closed on
Oct 15, 2004
Sold by
Macdonald Jim D
Bought by
Little Paul T
Current Estimated Value
Home Financials for this Owner
Home Financials are based on the most recent Mortgage that was taken out on this home.
Original Mortgage
$205,600
Interest Rate
5.74%
Mortgage Type
Purchase Money Mortgage
Purchase Details
Closed on
Sep 3, 2002
Sold by
Macdonald Jim D and Macdonald Dolores K
Bought by
Macdonald Jim D
Home Financials for this Owner
Home Financials are based on the most recent Mortgage that was taken out on this home.
Original Mortgage
$200,000
Interest Rate
6.41%
Purchase Details
Closed on
Nov 19, 1984
Bought by
Little Paul T and Anderson Katherine S
Purchase Details
Closed on
May 19, 1983
Bought by
Little Paul T and Anderson Katherine S
Purchase Details
Closed on
Dec 20, 1982
Bought by
Little Paul T and Anderson Katherine S
Create a Home Valuation Report for This Property
The Home Valuation Report is an in-depth analysis detailing your home's value as well as a comparison with similar homes in the area
Home Values in the Area
Average Home Value in this Area
Purchase History
| Date | Buyer | Sale Price | Title Company |
|---|---|---|---|
| Little Paul T | $257,000 | -- | |
| Macdonald Jim D | -- | Security Title | |
| Little Paul T | $106,000 | -- | |
| Little Paul T | $86,500 | -- | |
| Little Paul T | -- | -- |
Source: Public Records
Mortgage History
| Date | Status | Borrower | Loan Amount |
|---|---|---|---|
| Closed | Little Paul T | $205,600 | |
| Previous Owner | Macdonald Jim D | $200,000 | |
| Closed | Little Paul T | $38,550 |
Source: Public Records
Tax History Compared to Growth
Tax History
| Year | Tax Paid | Tax Assessment Tax Assessment Total Assessment is a certain percentage of the fair market value that is determined by local assessors to be the total taxable value of land and additions on the property. | Land | Improvement |
|---|---|---|---|---|
| 2025 | $4,130 | $47,050 | $23,800 | $23,250 |
| 2024 | $4,130 | $47,050 | $23,800 | $23,250 |
| 2023 | $4,060 | $45,949 | $25,829 | $23,805 |
| 2022 | $3,500 | $36,369 | $19,439 | $16,930 |
| 2021 | $3,687 | $39,811 | $21,278 | $18,533 |
| 2020 | $3,222 | $34,434 | $17,589 | $16,845 |
| 2019 | $3,177 | $34,434 | $17,589 | $16,845 |
| 2018 | $2,956 | $33,084 | $9,144 | $23,940 |
| 2017 | $2,897 | $36,576 | $10,109 | $26,467 |
| 2016 | $2,768 | $31,466 | $13,532 | $17,934 |
| 2015 | $2,624 | $26,634 | $14,646 | $11,988 |
| 2014 | $2,277 | $26,634 | $14,646 | $11,988 |
Source: Public Records
Map
Nearby Homes
- 474 W Spruce St
- 513 Adams Ave
- 310 W Spruce St
- 291 W Sycamore Ln
- 426 W Spruce Ln
- 701 Garfield Ave
- 1025 Sagebrush Way
- 516 Grant Ave
- 207 Short Place
- 300 Lois Dr
- 408 Fillmore Ct
- 1117 Lincoln Ave
- 501 Lois Dr
- 503 Lois Dr
- 159 S Polk Ave
- 593 Wildrose Way
- 529 Main St
- 724 Johnson St
- 1420 N Franklin Ct
- 494 Owl Dr Unit 4