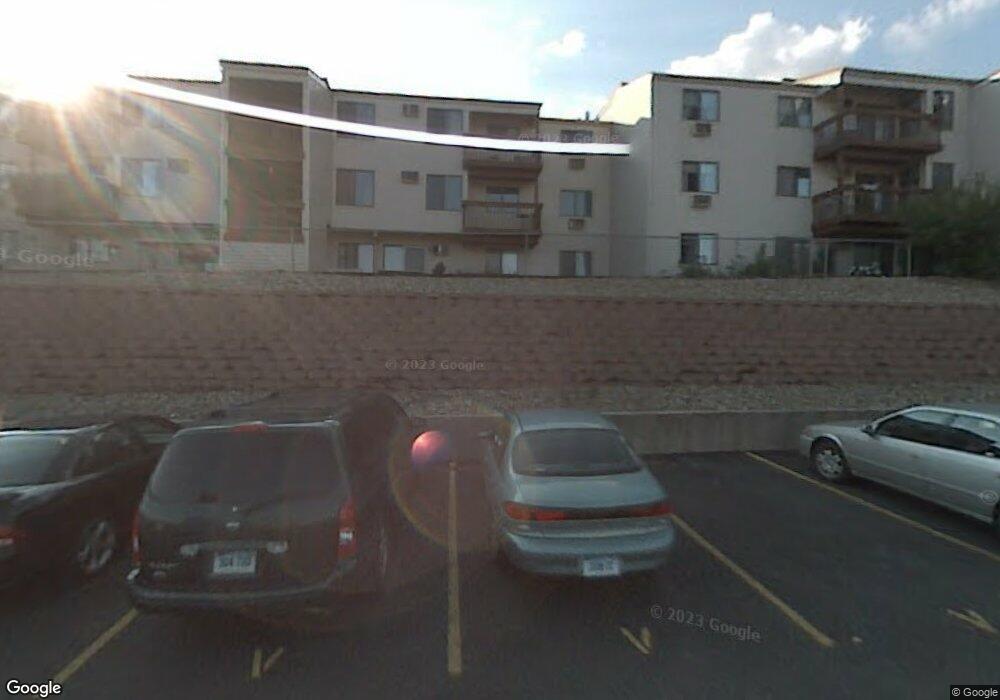
193 Woodland Dr Cromwell, CT 06416
Estimated Value: $172,000 - $210,000
2
Beds
1
Bath
854
Sq Ft
$229/Sq Ft
Est. Value
About This Home
This home is located at 193 Woodland Dr, Cromwell, CT 06416 and is currently estimated at $195,827, approximately $229 per square foot. 193 Woodland Dr is a home located in Middlesex County with nearby schools including Edna C. Stevens School, Woodside Intermediate School, and Cromwell Middle School.
Ownership History
Date
Name
Owned For
Owner Type
Purchase Details
Closed on
Aug 27, 2008
Sold by
James Darcey D
Bought by
Steele Nancy J
Current Estimated Value
Home Financials for this Owner
Home Financials are based on the most recent Mortgage that was taken out on this home.
Original Mortgage
$124,238
Interest Rate
6.29%
Purchase Details
Closed on
Jun 16, 2006
Sold by
Shaikh Maksud A and Shaikh Saeeda M
Bought by
James Darley D
Home Financials for this Owner
Home Financials are based on the most recent Mortgage that was taken out on this home.
Original Mortgage
$123,495
Interest Rate
6.62%
Purchase Details
Closed on
Oct 19, 1998
Sold by
Yocono Mark and Yocono Maria
Bought by
Shaikh Maksud A and Shaikh Saeeda M
Home Financials for this Owner
Home Financials are based on the most recent Mortgage that was taken out on this home.
Original Mortgage
$25,875
Interest Rate
6.64%
Create a Home Valuation Report for This Property
The Home Valuation Report is an in-depth analysis detailing your home's value as well as a comparison with similar homes in the area
Home Values in the Area
Average Home Value in this Area
Purchase History
| Date | Buyer | Sale Price | Title Company |
|---|---|---|---|
| Steele Nancy J | $126,500 | -- | |
| James Darley D | $123,496 | -- | |
| Shaikh Maksud A | $34,500 | -- |
Source: Public Records
Mortgage History
| Date | Status | Borrower | Loan Amount |
|---|---|---|---|
| Open | Shaikh Maksud A | $122,176 | |
| Closed | Shaikh Maksud A | $124,238 | |
| Previous Owner | Shaikh Maksud A | $123,495 | |
| Previous Owner | Shaikh Maksud A | $25,875 |
Source: Public Records
Tax History Compared to Growth
Tax History
| Year | Tax Paid | Tax Assessment Tax Assessment Total Assessment is a certain percentage of the fair market value that is determined by local assessors to be the total taxable value of land and additions on the property. | Land | Improvement |
|---|---|---|---|---|
| 2025 | $2,599 | $84,420 | $0 | $84,420 |
| 2024 | $2,539 | $84,420 | $0 | $84,420 |
| 2023 | $2,483 | $84,420 | $0 | $84,420 |
| 2022 | $2,013 | $60,410 | $0 | $60,410 |
| 2021 | $1,992 | $59,780 | $0 | $59,780 |
| 2020 | $1,963 | $59,780 | $0 | $59,780 |
| 2019 | $1,963 | $59,780 | $0 | $59,780 |
| 2018 | $1,963 | $59,780 | $0 | $59,780 |
| 2017 | $2,151 | $63,400 | $0 | $63,400 |
| 2016 | $2,132 | $63,400 | $0 | $63,400 |
| 2015 | $1,989 | $63,400 | $0 | $63,400 |
| 2014 | $2,110 | $63,400 | $0 | $63,400 |
Source: Public Records
Map
Nearby Homes
- 188 Woodland Dr
- 165 Woodland Dr Unit 165
- 96 Woodland Dr Unit 96
- 92 Woodland Dr Unit 92
- 148 Evergreen Rd
- 58 Blackhaw Dr
- 8 Mohawk Ct
- 30 Larkspur Dr
- 12 Sydney Ln
- 124 Coles Rd
- 2 Gatesville Ln Unit 6
- 9 Bayberry Ct
- 120 Washington Rd
- 7 Willow Ct Unit 7
- 110 Coles Rd
- 5 Chestnut Ct Unit 5
- 22 Linda Ct Unit 22
- 27 Chestnut Ct Unit 27
- 23 Margo Ct Unit 23
- 6 Juniper Hill Ct Unit 6
- 191 Woodland Dr
- 191 Woodland Dr Unit 191
- 192 Woodland Dr
- 194 Woodland Dr
- 194 Woodland Dr Unit 194
- 193 Woodland Dr Unit 193
- 196 Woodland Dr
- 196 Woodland Dr Unit 196
- 195 Woodland Dr
- 195 Woodland Dr Unit 195
- 197 Woodland Dr
- 198 Woodland Dr
- 198 Woodland Dr Unit 198
- 190 Woodland Dr
- 190 Woodland Dr Unit 190
- 200 Woodland Dr
- 200 Woodland Dr Unit 200
- 199 Woodland Dr
- 199 Woodland Dr Unit 199
- 187 Woodland Dr