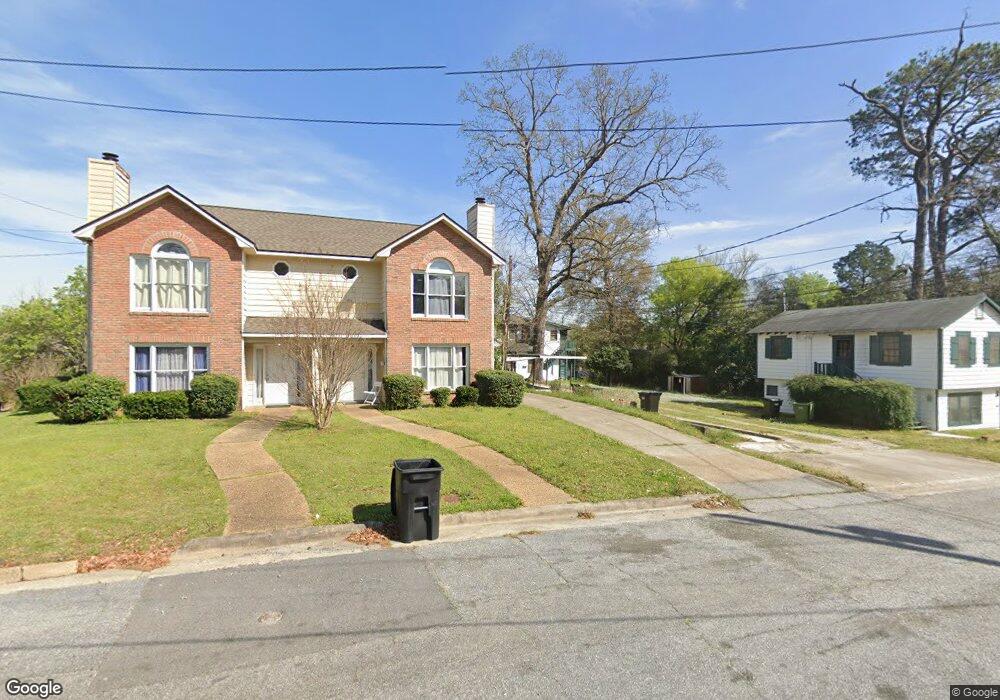
1930 16th Ave Columbus, GA 31901
Saint Elmo Weracoba NeighborhoodEstimated Value: $127,000 - $235,000
3
Beds
3
Baths
1,384
Sq Ft
$131/Sq Ft
Est. Value
About This Home
This home is located at 1930 16th Ave, Columbus, GA 31901 and is currently estimated at $180,679, approximately $130 per square foot. 1930 16th Ave is a home located in Muscogee County with nearby schools including Richards Middle School, Jordan Vocational High School, and Wynnton Elementary School.
Ownership History
Date
Name
Owned For
Owner Type
Purchase Details
Closed on
Nov 24, 2021
Sold by
Riley Joseph W
Bought by
Patriot Family Homes Georgia 3 Llc
Current Estimated Value
Home Financials for this Owner
Home Financials are based on the most recent Mortgage that was taken out on this home.
Original Mortgage
$2,500,000
Outstanding Balance
$2,299,652
Interest Rate
3.12%
Mortgage Type
New Conventional
Estimated Equity
-$2,118,973
Purchase Details
Closed on
Jan 10, 2019
Sold by
Patriot Family Homes Inc
Bought by
Woodlee Riley Joseph W and Woodlee Riley Rachel
Home Financials for this Owner
Home Financials are based on the most recent Mortgage that was taken out on this home.
Original Mortgage
$119,000
Interest Rate
4.6%
Mortgage Type
New Conventional
Purchase Details
Closed on
Feb 22, 2018
Sold by
Hudson Charles W
Bought by
Patriot Family Homes Inc
Create a Home Valuation Report for This Property
The Home Valuation Report is an in-depth analysis detailing your home's value as well as a comparison with similar homes in the area
Home Values in the Area
Average Home Value in this Area
Purchase History
| Date | Buyer | Sale Price | Title Company |
|---|---|---|---|
| Patriot Family Homes Georgia 3 Llc | -- | None Listed On Document | |
| Woodlee Riley Joseph W | -- | -- | |
| Patriot Family Homes Inc | $137,500 | -- |
Source: Public Records
Mortgage History
| Date | Status | Borrower | Loan Amount |
|---|---|---|---|
| Open | Patriot Family Homes Georgia 3 Llc | $2,500,000 | |
| Previous Owner | Woodlee Riley Joseph W | $119,000 |
Source: Public Records
Tax History Compared to Growth
Tax History
| Year | Tax Paid | Tax Assessment Tax Assessment Total Assessment is a certain percentage of the fair market value that is determined by local assessors to be the total taxable value of land and additions on the property. | Land | Improvement |
|---|---|---|---|---|
| 2025 | $2,016 | $51,496 | $7,256 | $44,240 |
| 2024 | $1,713 | $51,496 | $7,256 | $44,240 |
| 2023 | $2,028 | $51,496 | $7,256 | $44,240 |
| 2022 | $1,667 | $40,820 | $7,256 | $33,564 |
| 2021 | $1,347 | $38,460 | $6,980 | $31,480 |
| 2020 | $1,571 | $38,460 | $6,980 | $31,480 |
| 2019 | $1,131 | $27,595 | $5,008 | $22,587 |
| 2018 | $1,516 | $36,992 | $6,980 | $30,012 |
| 2017 | $1,520 | $36,992 | $6,980 | $30,012 |
| 2016 | $1,184 | $28,714 | $5,818 | $22,896 |
| 2015 | $474 | $28,714 | $5,818 | $22,896 |
| 2014 | $475 | $28,714 | $5,818 | $22,896 |
| 2013 | -- | $28,714 | $5,818 | $22,896 |
Source: Public Records
Map
Nearby Homes
- 1930 16th Ave Unit ID1299056P
- 1930 16th Ave Unit ID1043448P
- 1940 16th Ave Unit ID1043448P
- 1940 16th Ave
- 1630 Garrard St
- 1640 Garrard St
- 1913 17th Ave
- 1650 Garrard St
- 1925 17th Ave
- 1909 17th Ave
- 1927 17th Ave
- 1929 17th Ave
- 1905 17th Ave
- 1601 19th St
- 1520 20th St
- 1931 17th Ave
- 1901 17th Ave
- 12th 17th Ave
- 1510 20th St
- 1922 17th Ave