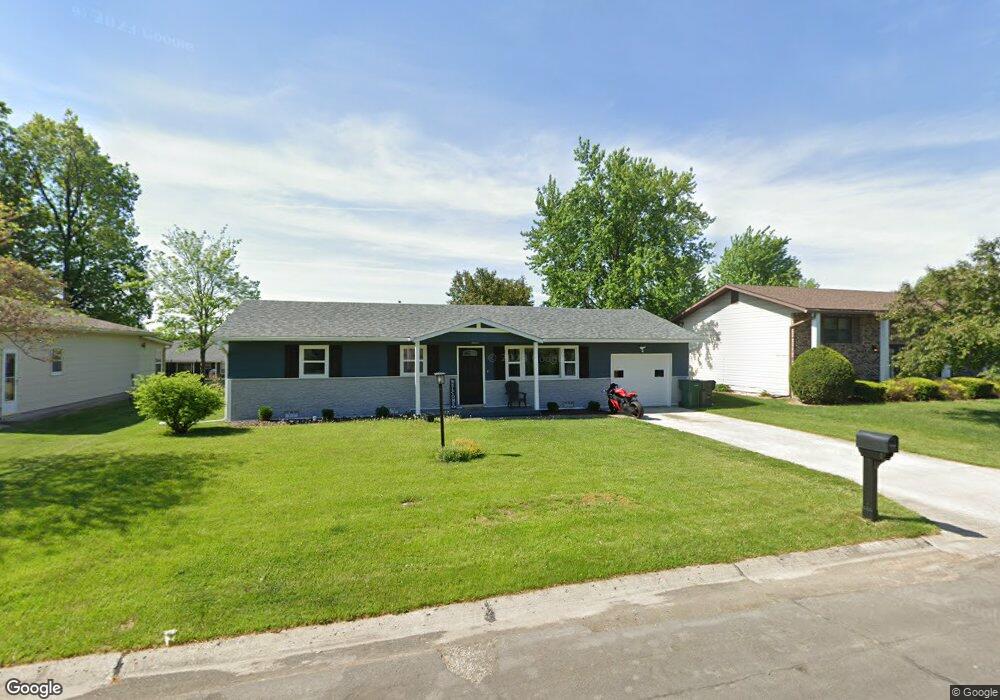
1930 Eastbrook Cir Moberly, MO 65270
Estimated Value: $182,000 - $212,000
3
Beds
2
Baths
1,380
Sq Ft
$143/Sq Ft
Est. Value
About This Home
This home is located at 1930 Eastbrook Cir, Moberly, MO 65270 and is currently estimated at $197,665, approximately $143 per square foot. 1930 Eastbrook Cir is a home located in Randolph County with nearby schools including Moberly Senior High School and Maranatha Seventh-day Adventist School.
Ownership History
Date
Name
Owned For
Owner Type
Purchase Details
Closed on
Feb 10, 2023
Sold by
Jhi Contracting Llc
Bought by
Johnson Cody A and Johnson Stephanie R
Current Estimated Value
Home Financials for this Owner
Home Financials are based on the most recent Mortgage that was taken out on this home.
Original Mortgage
$6,090
Outstanding Balance
$5,878
Interest Rate
6.12%
Estimated Equity
$191,787
Purchase Details
Closed on
Apr 22, 2022
Sold by
Haque Farris
Bought by
Jhi Contrancting Llc
Home Financials for this Owner
Home Financials are based on the most recent Mortgage that was taken out on this home.
Original Mortgage
$123,306
Interest Rate
3.85%
Mortgage Type
Credit Line Revolving
Purchase Details
Closed on
Aug 24, 2020
Sold by
Fry Eva L
Bought by
Haque Farris
Create a Home Valuation Report for This Property
The Home Valuation Report is an in-depth analysis detailing your home's value as well as a comparison with similar homes in the area
Home Values in the Area
Average Home Value in this Area
Purchase History
| Date | Buyer | Sale Price | Title Company |
|---|---|---|---|
| Johnson Cody A | -- | -- | |
| Jhi Contrancting Llc | -- | -- | |
| Haque Farris | -- | None Available |
Source: Public Records
Mortgage History
| Date | Status | Borrower | Loan Amount |
|---|---|---|---|
| Open | Johnson Cody A | $6,090 | |
| Open | Johnson Cody A | $170,848 | |
| Previous Owner | Jhi Contrancting Llc | $123,306 |
Source: Public Records
Tax History
| Year | Tax Paid | Tax Assessment Tax Assessment Total Assessment is a certain percentage of the fair market value that is determined by local assessors to be the total taxable value of land and additions on the property. | Land | Improvement |
|---|---|---|---|---|
| 2025 | $1,365 | $22,980 | $3,270 | $19,710 |
| 2024 | $14 | $18,740 | $2,850 | $15,890 |
| 2023 | $1,385 | $18,740 | $2,850 | $15,890 |
| 2022 | $1,262 | $17,530 | $2,850 | $14,680 |
| 2020 | $1,230 | $17,100 | $2,850 | $14,250 |
| 2019 | $1,228 | $17,100 | $2,850 | $14,250 |
| 2018 | $1,224 | $17,100 | $2,850 | $14,250 |
| 2017 | $1,237 | $17,310 | $0 | $0 |
| 2016 | $1,188 | $16,720 | $0 | $0 |
| 2014 | -- | $15,670 | $0 | $0 |
| 2013 | -- | $15,670 | $0 | $0 |
| 2012 | -- | $15,670 | $0 | $0 |
Source: Public Records
Map
Nearby Homes
- 616 Meadowbrook Cir
- 622 Meadowbrook Cir
- 628 Woodland Ave
- 1006 Bradford Cir
- 216 Lotter St
- 712 Farror St
- 402 Halleck St
- 722 Vincil St
- 204 Bertley St
- 1150 S Morley St
- 409 Barrow St
- 2003 County Road 1740
- 321 Farror St
- 101 N Ault St
- 537 Fulton Ave
- 508 S Williams St
- 619 Madison Ave
- 1000 S Williams St
- 1215 Shepherds Dr
- 612 S 4th St
- 1924 Eastbrook Cir
- 1936 Eastbrook Cir
- 1918 Eastbrook Cir
- 600 Mckinsey Place
- 1925 Eastbrook Cir
- 1919 Eastbrook Cir
- 1931 Eastbrook Cir
- 1948 Eastbrook Cir
- 605 Mckinsey Place
- 1937 Eastbrook Cir
- 1913 Eastbrook Cir
- 1912 Eastbrook Cir
- 1907 Eastbrook Cir
- 606 Mckinsey Place
- 1626 Prairie Ln
- 1632 Prairie Ln
- 1906 Eastbrook Cir
- 1943 Eastbrook Cir
- 1620 Prairie Ln
- 610 Meadowbrook Cir
Your Personal Tour Guide
Ask me questions while you tour the home.