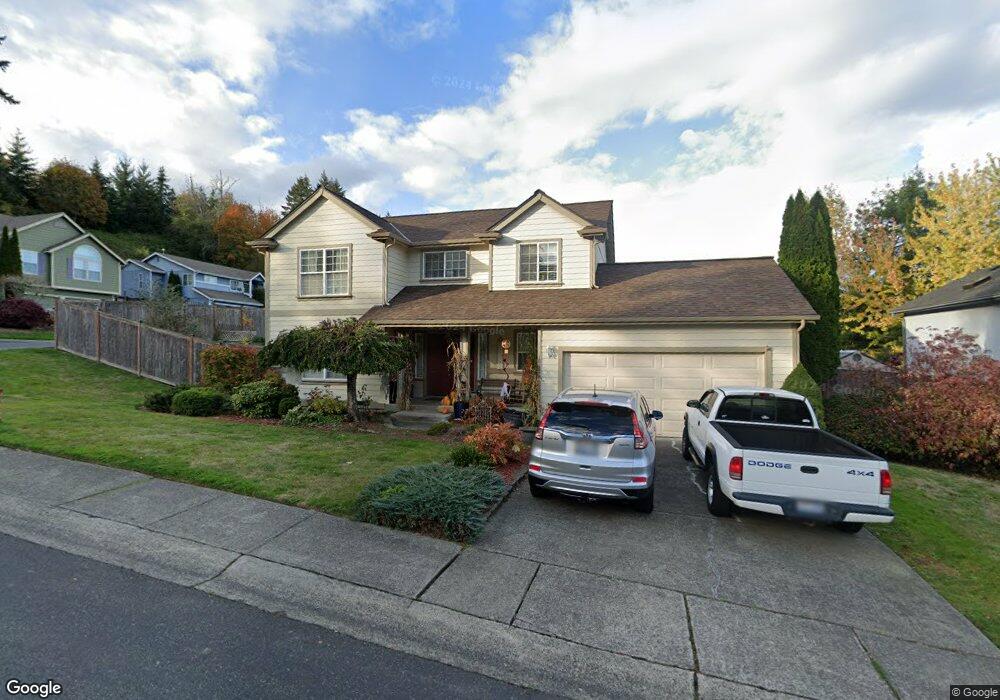
1930 Miss Ellis Loop NE Poulsbo, WA 98370
Estimated Value: $589,730 - $665,000
3
Beds
3
Baths
1,812
Sq Ft
$345/Sq Ft
Est. Value
About This Home
This home is located at 1930 Miss Ellis Loop NE, Poulsbo, WA 98370 and is currently estimated at $624,683, approximately $344 per square foot. 1930 Miss Ellis Loop NE is a home located in Kitsap County with nearby schools including Poulsbo Elementary School, Poulsbo Middle School, and North Kitsap High School.
Ownership History
Date
Name
Owned For
Owner Type
Purchase Details
Closed on
Apr 10, 2015
Sold by
Munroe Debbie and Estate Of Casmer Tuholski & Ma
Bought by
Munroe Debbie and Casmer Tuholski
Current Estimated Value
Purchase Details
Closed on
Apr 21, 2003
Sold by
Pelliciotta John P and Pelliciotta Elizabeth N
Bought by
Tuholski Casmer and Tuholski Marcia L
Purchase Details
Closed on
Nov 3, 1998
Sold by
Pelliciotta John P
Bought by
Pelliciotta John P and Pelliciotta Elizabeth N
Home Financials for this Owner
Home Financials are based on the most recent Mortgage that was taken out on this home.
Original Mortgage
$152,641
Interest Rate
6.54%
Mortgage Type
VA
Purchase Details
Closed on
Apr 1, 1996
Sold by
Schneider Homes Inc
Bought by
Pelliciotta John P
Home Financials for this Owner
Home Financials are based on the most recent Mortgage that was taken out on this home.
Original Mortgage
$150,858
Interest Rate
7.34%
Mortgage Type
VA
Create a Home Valuation Report for This Property
The Home Valuation Report is an in-depth analysis detailing your home's value as well as a comparison with similar homes in the area
Home Values in the Area
Average Home Value in this Area
Purchase History
| Date | Buyer | Sale Price | Title Company |
|---|---|---|---|
| Munroe Debbie | -- | None Available | |
| Munroe Debbie | -- | None Available | |
| Tuholski Casmer | $233,100 | Transnation Title Insurance | |
| Pelliciotta John P | -- | Transnation Title Ins Co | |
| Pelliciotta John P | $147,900 | Transnation Title Insurance |
Source: Public Records
Mortgage History
| Date | Status | Borrower | Loan Amount |
|---|---|---|---|
| Previous Owner | Pelliciotta John P | $152,641 | |
| Previous Owner | Pelliciotta John P | $150,858 |
Source: Public Records
Tax History Compared to Growth
Tax History
| Year | Tax Paid | Tax Assessment Tax Assessment Total Assessment is a certain percentage of the fair market value that is determined by local assessors to be the total taxable value of land and additions on the property. | Land | Improvement |
|---|---|---|---|---|
| 2026 | $4,618 | $514,630 | $113,760 | $400,870 |
| 2025 | $4,618 | $514,630 | $113,760 | $400,870 |
| 2024 | $4,131 | $473,950 | $106,370 | $367,580 |
| 2023 | $4,201 | $473,950 | $106,370 | $367,580 |
| 2022 | $3,727 | $399,830 | $92,340 | $307,490 |
| 2021 | $3,605 | $358,410 | $82,730 | $275,680 |
| 2020 | $3,505 | $342,350 | $79,040 | $263,310 |
| 2019 | $3,290 | $321,280 | $73,870 | $247,410 |
| 2018 | $3,027 | $251,080 | $56,100 | $194,980 |
| 2017 | $2,886 | $251,080 | $56,100 | $194,980 |
| 2016 | $2,959 | $237,150 | $56,100 | $181,050 |
| 2015 | -- | $230,190 | $56,100 | $174,090 |
| 2014 | -- | $220,440 | $56,100 | $164,340 |
| 2013 | -- | $220,440 | $56,100 | $164,340 |
Source: Public Records
Map
Nearby Homes
- 18130 Sunrise Ridge Ave NE
- 1610 NE Mount Kamela Ct
- 2405 NE Waterlily Way
- 17505 NE Midnight Sun Loop
- Luna Plan at Liberty Bay Vista
- Rainier Plan at Liberty Bay Vista
- Bennett Plan at Liberty Bay Vista
- Bennett (Basement) Plan at Liberty Bay Vista
- Noah (Basement) Plan at Liberty Bay Vista
- Warren Plan at Liberty Bay Vista
- Raymond Plan at Liberty Bay Vista
- Asher Plan at Liberty Bay Vista
- Noah Plan at Liberty Bay Vista
- Luna (Basement) Plan at Liberty Bay Vista
- 2040 NE Norseman Way
- 2019 NE Norseman Way
- 2046 NE Norseman Way
- 2052 NE Norseman Way
- 17523 NE Midnight Sun Loop
- 2058 NE Norseman Way
- 18082 Miss Ellis Loop NE
- 1925 Miss Ellis Loop NE
- 18055 Miss Ellis Loop NE
- 1945 Miss Ellis Loop NE
- 1965 NE Lind Ct
- 1965 NE Lind Ct
- 18085 Miss Ellis Loop NE
- 1980 Miss Ellis Loop NE
- 1885 Miss Ellis Loop NE
- 1895 Miss Ellis Loop NE
- 1975 Miss Ellis Loop NE
- 1986 NE Eastmont Ct
- 18105 Miss Ellis Loop NE
- 1988 NE Eastmont Ct
- 1984 NE Eastmont Ct
- 1989 NE Eastmont Ct
- 1995 NE Lind Ct
- 18130 Miss Ellis Loop NE
- 2010 Miss Ellis Loop NE