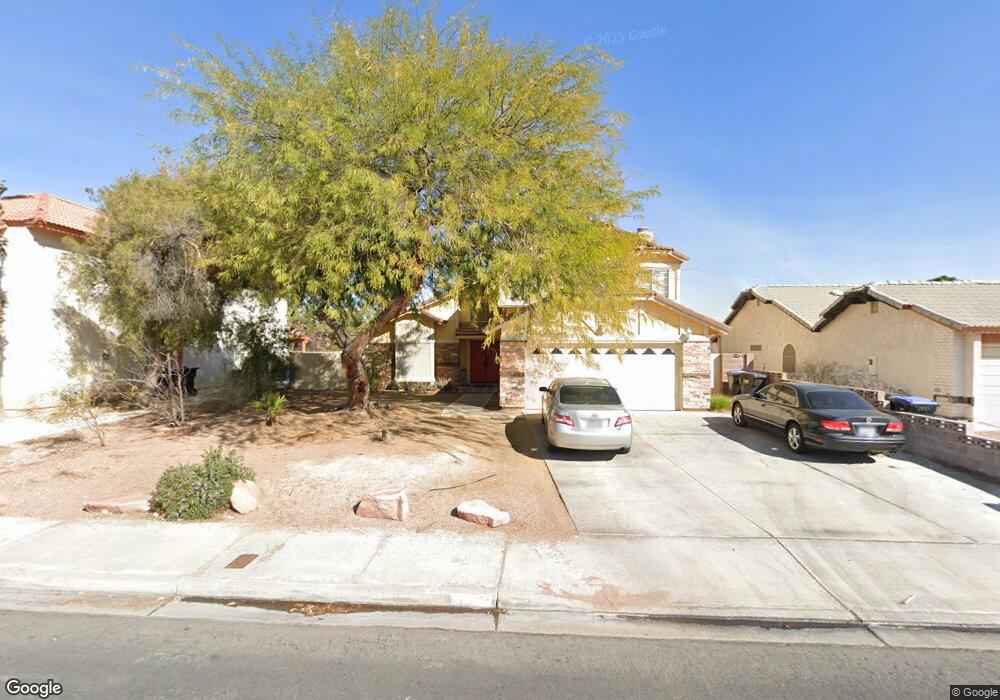
1930 Nuevo Rd Henderson, NV 89014
Green Valley North NeighborhoodEstimated Value: $462,068 - $513,000
3
Beds
3
Baths
2,025
Sq Ft
$244/Sq Ft
Est. Value
About This Home
This home is located at 1930 Nuevo Rd, Henderson, NV 89014 and is currently estimated at $494,517, approximately $244 per square foot. 1930 Nuevo Rd is a home located in Clark County with nearby schools including Estes M Mcdoniel Elementary School, Barbara and Hank Greenspun Junior High School, and Green Valley High School.
Ownership History
Date
Name
Owned For
Owner Type
Purchase Details
Closed on
Aug 27, 2010
Sold by
Flagstar Bank Fsb
Bought by
Hopkins David L and Hopkins Karen R
Current Estimated Value
Home Financials for this Owner
Home Financials are based on the most recent Mortgage that was taken out on this home.
Original Mortgage
$152,940
Outstanding Balance
$102,568
Interest Rate
4.75%
Mortgage Type
FHA
Estimated Equity
$391,949
Purchase Details
Closed on
Apr 28, 2010
Sold by
Saloma Rudy Z and Saloma Barbara M
Bought by
Flagstar Bank Fsb
Purchase Details
Closed on
Jul 5, 2005
Sold by
Parham Michael
Bought by
Saloma Rudy Z and Saloma Barbara M
Home Financials for this Owner
Home Financials are based on the most recent Mortgage that was taken out on this home.
Original Mortgage
$276,000
Interest Rate
4.87%
Mortgage Type
Unknown
Purchase Details
Closed on
May 15, 2003
Sold by
Colianni James J and Colianni Marcia A
Bought by
Parham Michael and Parham Mayme
Create a Home Valuation Report for This Property
The Home Valuation Report is an in-depth analysis detailing your home's value as well as a comparison with similar homes in the area
Home Values in the Area
Average Home Value in this Area
Purchase History
| Date | Buyer | Sale Price | Title Company |
|---|---|---|---|
| Hopkins David L | $155,000 | Fidelity National | |
| Flagstar Bank Fsb | $180,001 | Lawyers Title Company | |
| Saloma Rudy Z | $345,000 | Ticor Title Of Nevada Inc | |
| Parham Michael | $197,400 | United Title Of Nevada |
Source: Public Records
Mortgage History
| Date | Status | Borrower | Loan Amount |
|---|---|---|---|
| Open | Hopkins David L | $152,940 | |
| Previous Owner | Saloma Rudy Z | $276,000 |
Source: Public Records
Tax History Compared to Growth
Tax History
| Year | Tax Paid | Tax Assessment Tax Assessment Total Assessment is a certain percentage of the fair market value that is determined by local assessors to be the total taxable value of land and additions on the property. | Land | Improvement |
|---|---|---|---|---|
| 2025 | $1,677 | $86,101 | $38,500 | $47,601 |
| 2024 | $1,628 | $86,101 | $38,500 | $47,601 |
| 2023 | $1,329 | $85,503 | $39,200 | $46,303 |
| 2022 | $1,581 | $73,842 | $30,800 | $43,042 |
| 2021 | $1,535 | $71,331 | $29,750 | $41,581 |
| 2020 | $1,488 | $70,373 | $28,700 | $41,673 |
| 2019 | $1,444 | $65,657 | $24,150 | $41,507 |
| 2018 | $1,402 | $61,380 | $21,000 | $40,380 |
| 2017 | $1,810 | $62,435 | $21,000 | $41,435 |
| 2016 | $1,329 | $58,561 | $16,450 | $42,111 |
| 2015 | $1,325 | $52,415 | $12,600 | $39,815 |
| 2014 | $1,286 | $43,087 | $8,750 | $34,337 |
Source: Public Records
Map
Nearby Homes
- 1926 Navarre Ln
- 372 Rushing Creek Ct
- 347 Gana Ct Unit B
- 1939 Guinn Dr
- 316 Santa Monica Dr
- 1832 Muchacha Dr
- 322 Oliveiro Ct
- 272 Grand Teton Dr
- 2108 Running River Rd
- 374 Santali Ct
- 346 Pinnacle Ct
- 259 Spring Hills Ln
- 327 Fuente Dr
- 1810 Nuevo Rd
- 2050 W Warm Springs Rd Unit 312
- 2050 W Warm Springs Rd Unit 4521
- 2050 W Warm Springs Rd Unit 1311
- 2050 W Warm Springs Rd Unit 3624
- 2050 W Warm Springs Rd Unit 224
- 2050 W Warm Springs Rd Unit 411
- 1928 Nuevo Rd
- 1932 Nuevo Rd
- 355 Orchard Ct
- 353 Orchard Ct
- 351 Orchard Ct
- 357 Orchard Ct
- 1930 Navarre Ln
- 341 Simon Bolivar Dr
- 352 Rushing Creek Ct
- 1928 Navarre Ln
- 350 Rushing Creek Ct
- 344 Moreno Ct
- 359 Orchard Ct
- 354 Rushing Creek Ct
- 339 Simon Bolivar Dr
- 340 Simon Bolivar Dr
- 342 Moreno Ct
- 361 Orchard Ct
- 350 Orchard Ct
- 356 Rushing Creek Ct