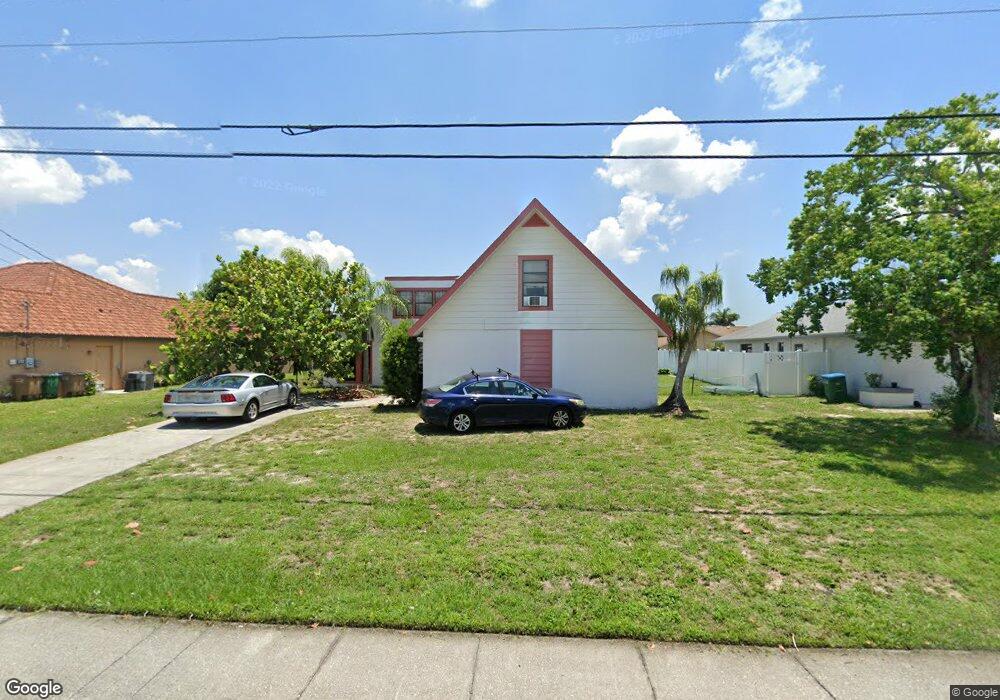
1930 Viscaya Pkwy Unit 18 Cape Coral, FL 33990
Hancock NeighborhoodEstimated Value: $295,000 - $383,000
3
Beds
2
Baths
2,448
Sq Ft
$130/Sq Ft
Est. Value
About This Home
This home is located at 1930 Viscaya Pkwy Unit 18, Cape Coral, FL 33990 and is currently estimated at $319,306, approximately $130 per square foot. 1930 Viscaya Pkwy Unit 18 is a home located in Lee County with nearby schools including Caloosa Elementary School, Tropic Isles Elementary School, and Hancock Creek Elementary School.
Ownership History
Date
Name
Owned For
Owner Type
Purchase Details
Closed on
May 3, 2011
Sold by
Vanderwey Henry
Bought by
Irrevocable Henricus A Hendry Vanderwey
Current Estimated Value
Purchase Details
Closed on
Feb 23, 2011
Sold by
Fannie Mae
Bought by
Vanderwey Henry
Purchase Details
Closed on
Sep 21, 2010
Sold by
Francisco Francis G
Bought by
Federal National Mortgage Association
Purchase Details
Closed on
Mar 27, 2006
Sold by
Taitano Esther F
Bought by
Francisco Francis G
Purchase Details
Closed on
Jun 10, 1999
Sold by
Ocwen Fed Bk F S B
Bought by
Taitano Ester F
Home Financials for this Owner
Home Financials are based on the most recent Mortgage that was taken out on this home.
Original Mortgage
$68,964
Interest Rate
6.94%
Mortgage Type
FHA
Create a Home Valuation Report for This Property
The Home Valuation Report is an in-depth analysis detailing your home's value as well as a comparison with similar homes in the area
Home Values in the Area
Average Home Value in this Area
Purchase History
| Date | Buyer | Sale Price | Title Company |
|---|---|---|---|
| Irrevocable Henricus A Hendry Vanderwey | -- | Attorney | |
| Vanderwey Henry | $57,000 | Attorney | |
| Federal National Mortgage Association | -- | None Available | |
| Francisco Francis G | $62,197 | None Available | |
| Taitano Ester F | $69,000 | -- |
Source: Public Records
Mortgage History
| Date | Status | Borrower | Loan Amount |
|---|---|---|---|
| Previous Owner | Taitano Ester F | $68,964 |
Source: Public Records
Tax History Compared to Growth
Tax History
| Year | Tax Paid | Tax Assessment Tax Assessment Total Assessment is a certain percentage of the fair market value that is determined by local assessors to be the total taxable value of land and additions on the property. | Land | Improvement |
|---|---|---|---|---|
| 2025 | $4,443 | $218,482 | -- | -- |
| 2024 | $4,443 | $198,620 | -- | -- |
| 2023 | $3,892 | $180,564 | $0 | $0 |
| 2022 | $3,537 | $164,149 | $0 | $0 |
| 2021 | $3,166 | $149,715 | $31,000 | $118,715 |
| 2020 | $3,003 | $135,660 | $31,750 | $103,910 |
| 2019 | $2,862 | $129,199 | $25,000 | $104,199 |
| 2018 | $2,934 | $130,815 | $25,000 | $105,815 |
| 2017 | $2,842 | $134,861 | $18,000 | $116,861 |
| 2016 | $2,572 | $113,149 | $18,000 | $95,149 |
| 2015 | $2,370 | $98,610 | $14,500 | $84,110 |
| 2014 | -- | $91,612 | $11,280 | $80,332 |
| 2013 | -- | $88,994 | $9,700 | $79,294 |
Source: Public Records
Map
Nearby Homes
- 1927 SE 10th St
- 940 SE 20th Ct
- 1025 SE 20th Ave
- 928 SE 21st Place
- 1814 SE 9th Terrace
- 2117 SE 9th Terrace
- 2110 SE 10th Terrace
- 1725 SE 9th Terrace
- 1928 SE 11th Terrace
- 1062 SE 21st Ave
- 1826 SE 6th Ln
- 2129 SE 6th Ln
- 1921 SE 12th St
- 2210 SE 8th Terrace
- 2014 SE 12th St
- 1707 Viscaya Pkwy
- 1930 SE 12th St
- 2216 SE 8th Terrace
- 2215 SE 10th Ln
- 1812 SE 6th Terrace
- 2004 Viscaya Pkwy
- 1926 Viscaya Pkwy
- 1929 SE 9th Terrace
- 2003 SE 9th Terrace
- 1925 SE 9th Terrace
- 2008 Viscaya Pkwy
- 1922 Viscaya Pkwy
- 2007 SE 9th Terrace
- 1921 SE 9th Terrace
- 1929 Viscaya Pkwy
- 1925 Viscaya Pkwy
- 1918 Viscaya Pkwy
- 2003 Viscaya Pkwy
- 2011 SE 9th Terrace
- 1917 SE 9th Terrace
- 1921 Viscaya Pkwy
- 1932 SE 9th Terrace
- 1928 SE 9th Terrace
- 1914 Viscaya Pkwy
- 2008 SE 9th Terrace Unit 18