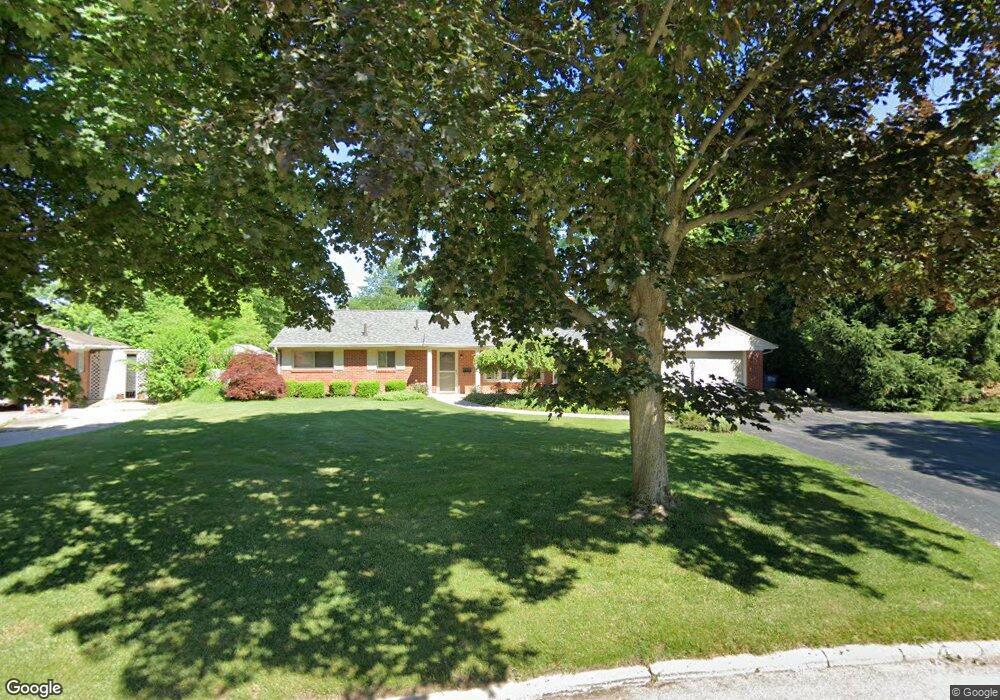
1930 W Crest Dr Toledo, OH 43614
Southwyck NeighborhoodEstimated Value: $196,000 - $245,306
3
Beds
2
Baths
1,550
Sq Ft
$142/Sq Ft
Est. Value
About This Home
This home is located at 1930 W Crest Dr, Toledo, OH 43614 and is currently estimated at $219,827, approximately $141 per square foot. 1930 W Crest Dr is a home located in Lucas County with nearby schools including Glendale-Feilbach Elementary School, Bowsher High School, and Northwest Ohio Classical Academy.
Ownership History
Date
Name
Owned For
Owner Type
Purchase Details
Closed on
Jul 17, 2000
Sold by
Mallow Casey C and Mallow Lynn M
Bought by
Miles Jay A and Gerbers Ruth L
Current Estimated Value
Home Financials for this Owner
Home Financials are based on the most recent Mortgage that was taken out on this home.
Original Mortgage
$109,350
Interest Rate
8.31%
Purchase Details
Closed on
May 8, 1998
Sold by
Ward Forrest and Ward Eleanor
Bought by
Mallow Casey C and Mallow Lynn M
Home Financials for this Owner
Home Financials are based on the most recent Mortgage that was taken out on this home.
Original Mortgage
$104,667
Interest Rate
7.2%
Mortgage Type
FHA
Purchase Details
Closed on
Jun 4, 1990
Sold by
Ramm Richard A and Ramm Sandra K
Create a Home Valuation Report for This Property
The Home Valuation Report is an in-depth analysis detailing your home's value as well as a comparison with similar homes in the area
Home Values in the Area
Average Home Value in this Area
Purchase History
| Date | Buyer | Sale Price | Title Company |
|---|---|---|---|
| Miles Jay A | $121,900 | Northwest Title Agency Of Oh | |
| Mallow Casey C | $105,000 | Midland Title | |
| -- | $90,000 | -- |
Source: Public Records
Mortgage History
| Date | Status | Borrower | Loan Amount |
|---|---|---|---|
| Previous Owner | Miles Jay A | $109,350 | |
| Previous Owner | Mallow Casey C | $104,667 |
Source: Public Records
Tax History Compared to Growth
Tax History
| Year | Tax Paid | Tax Assessment Tax Assessment Total Assessment is a certain percentage of the fair market value that is determined by local assessors to be the total taxable value of land and additions on the property. | Land | Improvement |
|---|---|---|---|---|
| 2024 | $1,491 | $58,100 | $9,940 | $48,160 |
| 2023 | $2,557 | $48,580 | $8,575 | $40,005 |
| 2022 | $2,582 | $48,580 | $8,575 | $40,005 |
| 2021 | $2,638 | $48,580 | $8,575 | $40,005 |
| 2020 | $2,383 | $40,180 | $7,070 | $33,110 |
| 2019 | $2,321 | $40,180 | $7,070 | $33,110 |
| 2018 | $2,278 | $40,180 | $7,070 | $33,110 |
| 2017 | $2,243 | $37,590 | $11,655 | $25,935 |
| 2016 | $2,246 | $107,400 | $33,300 | $74,100 |
| 2015 | $2,227 | $107,400 | $33,300 | $74,100 |
| 2014 | $1,824 | $37,600 | $11,660 | $25,940 |
| 2013 | $1,824 | $37,600 | $11,660 | $25,940 |
Source: Public Records
Map
Nearby Homes
- 2020 W Crest Dr
- 4796 Ryan Ridge Place
- 2155 Bishopsgate Dr
- 1933 Woodlore Dr
- 1415 Creekwood Ln
- 2017 Green Valley Dr
- 4534 Heathercove Place
- 5533 Cresthaven Ln
- 5366 Glenridge Dr
- 4866 Airport Hwy
- 1253 Eastgate Rd
- 1240 Westgate Rd
- 2451 Eastgate Rd
- 1533 Eaglebrook Rd
- 5150 Norton Place
- 1562 Saddlebrook Ct Unit B
- 5035 Norwich Rd
- 5615 Baronswood Cir
- 1518 Cherrylawn Dr
- 5741 Heatherbank Rd
- 1936 W Crest Dr
- 1928 W Crest Dr
- 1946 W Crest Dr
- 1926 E Crest Dr
- 1935 W Crest Dr
- 1925 W Crest Dr
- 1918 Daleview Ct
- 1949 W Crest Dr
- 1930 E Crest Dr
- 2002 W Crest Dr
- 2001 W Crest Dr
- 1948 E Crest Dr
- 1958 E Crest Dr
- 1914 Daleview Ct
- 2009 W Crest Dr
- 2012 W Crest Dr
- 4918 Glendale Ave
- 1927 Daleview Ct
- 1937 E Crest Dr
- 2010 E Crest Dr