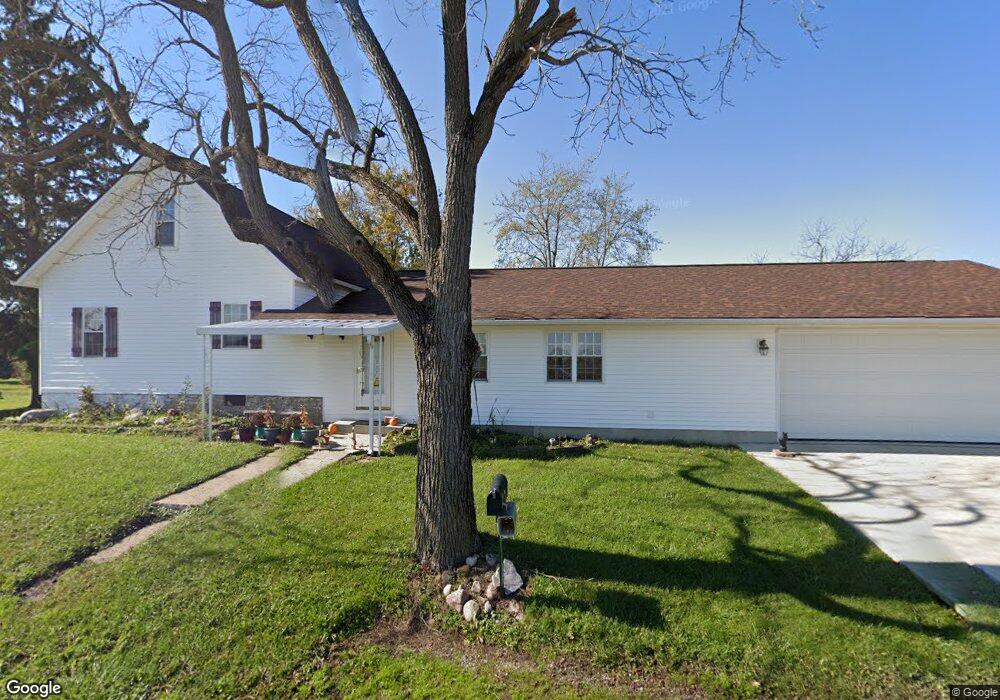
19301 Gant Rd Waynesfield, OH 45896
Estimated Value: $165,000 - $542,075
4
Beds
1
Bath
2,157
Sq Ft
$164/Sq Ft
Est. Value
About This Home
This home is located at 19301 Gant Rd, Waynesfield, OH 45896 and is currently estimated at $353,538, approximately $163 per square foot. 19301 Gant Rd is a home located in Auglaize County with nearby schools including Waynesfield-Goshen Local Elementary School and Waynesfield-Goshen Local High School.
Ownership History
Date
Name
Owned For
Owner Type
Purchase Details
Closed on
Mar 21, 2016
Sold by
Branham E Richard
Bought by
Fisher Miller Melinda A
Current Estimated Value
Purchase Details
Closed on
Jun 12, 2015
Sold by
Branham E Richard and Branham Earl Richard
Bought by
Ritchey Donald A and Ritchey Karla R
Home Financials for this Owner
Home Financials are based on the most recent Mortgage that was taken out on this home.
Original Mortgage
$150,000
Interest Rate
3.65%
Mortgage Type
Purchase Money Mortgage
Purchase Details
Closed on
Aug 1, 2011
Sold by
Branham Tammy L
Bought by
Branham E Richard
Purchase Details
Closed on
Jul 11, 2002
Sold by
Dixon Clarence
Bought by
Branham E Richard
Create a Home Valuation Report for This Property
The Home Valuation Report is an in-depth analysis detailing your home's value as well as a comparison with similar homes in the area
Home Values in the Area
Average Home Value in this Area
Purchase History
| Date | Buyer | Sale Price | Title Company |
|---|---|---|---|
| Fisher Miller Melinda A | -- | Attorney | |
| Ritchey Donald A | $273,800 | Attorney | |
| Branham E Richard | -- | None Available | |
| Branham E Richard | $122,500 | -- |
Source: Public Records
Mortgage History
| Date | Status | Borrower | Loan Amount |
|---|---|---|---|
| Previous Owner | Ritchey Donald A | $150,000 |
Source: Public Records
Tax History Compared to Growth
Tax History
| Year | Tax Paid | Tax Assessment Tax Assessment Total Assessment is a certain percentage of the fair market value that is determined by local assessors to be the total taxable value of land and additions on the property. | Land | Improvement |
|---|---|---|---|---|
| 2024 | $2,793 | $44,400 | $9,600 | $34,800 |
| 2023 | $1,592 | $44,400 | $9,600 | $34,800 |
| 2022 | $1,489 | $33,460 | $7,550 | $25,910 |
| 2021 | $1,447 | $33,460 | $7,550 | $25,910 |
| 2020 | $1,392 | $33,457 | $7,546 | $25,911 |
| 2019 | $1,341 | $33,457 | $7,546 | $25,911 |
| 2018 | $1,278 | $32,690 | $7,546 | $25,144 |
| 2017 | $1,026 | $25,648 | $7,546 | $18,102 |
| 2016 | $969 | $25,410 | $7,189 | $18,221 |
| 2015 | $977 | $25,410 | $7,189 | $18,221 |
| 2014 | $2,181 | $57,558 | $28,189 | $29,369 |
| 2013 | $3,238 | $57,558 | $28,189 | $29,369 |
Source: Public Records
Map
Nearby Homes
- 8150 Amherst Rd
- 105 Guthrie St
- 202 W Mulberry St
- 25836 Ohio 67
- 5065 Amherst Rd
- 7165 Faulkner Rd
- 22275 Buckland Holden Rd
- 6616 Bellefontaine Rd
- 6381 McPheron Rd
- 200 S Main St
- 5600 E Hanthorn Rd
- E Hanthorn Rd
- 0 Ohio 235
- 1855 S Cool Rd
- 4160 E Hanthorn Rd
- 6782 County Road 15
- 20630 State Route 67
- 203 Belmont St
- 000 Phillips Rd
- 900 N Front St
- 19599 Gant Rd
- 19600 Gant Rd
- 26996 Buckland Holden Rd
- 19771 Gant Rd
- 18833 Gant Rd
- 19788 Gant Rd
- 27409 Buckland Holden Rd
- 27412 Buckland Holden Rd
- 27525 Buckland Holden Rd
- 19879 Gant Rd
- 27408 Buckland Holden Rd
- 26475 Buckland Holden Rd
- 27474 Buckland Holden Rd
- 19833 State Route 117
- 8901 Auglaize Rd
- 8877 Auglaize Rd
- 26596 Allen Union Wayne Rd
- 19930 State Route 117
- 18524 Gant Rd