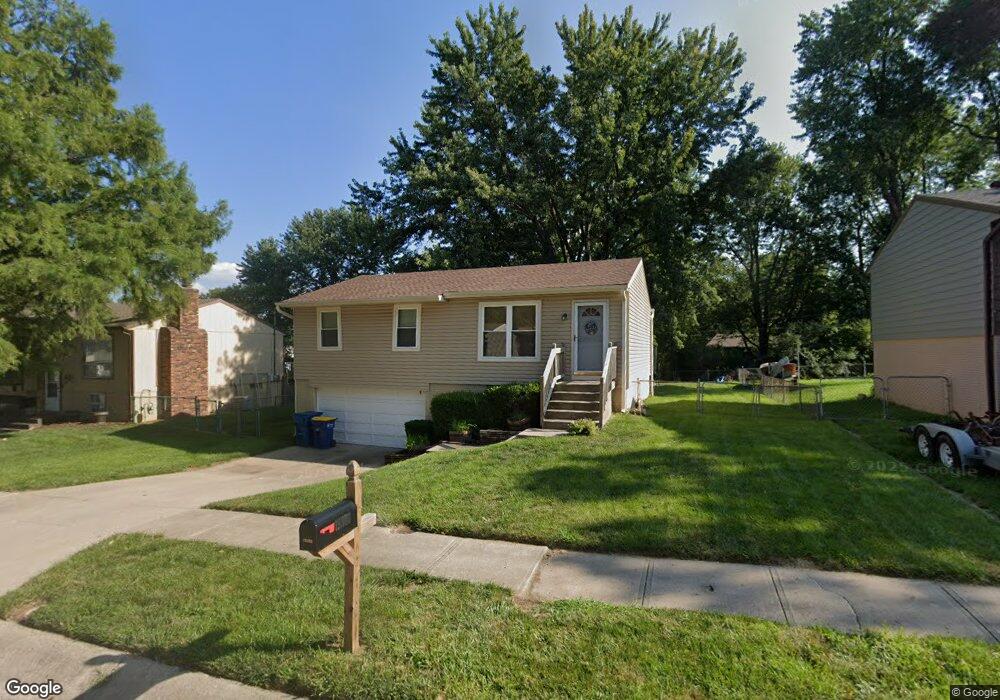
19305 E 5th Terrace Ct N Independence, MO 64056
Randall NeighborhoodEstimated Value: $188,000 - $212,000
3
Beds
2
Baths
1,053
Sq Ft
$192/Sq Ft
Est. Value
About This Home
This home is located at 19305 E 5th Terrace Ct N, Independence, MO 64056 and is currently estimated at $202,653, approximately $192 per square foot. 19305 E 5th Terrace Ct N is a home located in Jackson County with nearby schools including Fort Osage High School.
Ownership History
Date
Name
Owned For
Owner Type
Purchase Details
Closed on
Jun 26, 2002
Sold by
Miles Melissa L
Bought by
Miles Damon C
Current Estimated Value
Home Financials for this Owner
Home Financials are based on the most recent Mortgage that was taken out on this home.
Original Mortgage
$71,957
Interest Rate
6.05%
Mortgage Type
FHA
Purchase Details
Closed on
Jun 30, 2000
Sold by
Huke Robert L
Bought by
Miles Damon C and Miles Melissa L
Home Financials for this Owner
Home Financials are based on the most recent Mortgage that was taken out on this home.
Original Mortgage
$73,512
Interest Rate
8.66%
Mortgage Type
FHA
Purchase Details
Closed on
Mar 26, 1997
Sold by
Stevenson Shelly Dann
Bought by
Huke Robert L
Home Financials for this Owner
Home Financials are based on the most recent Mortgage that was taken out on this home.
Original Mortgage
$58,700
Interest Rate
7.55%
Mortgage Type
Purchase Money Mortgage
Create a Home Valuation Report for This Property
The Home Valuation Report is an in-depth analysis detailing your home's value as well as a comparison with similar homes in the area
Home Values in the Area
Average Home Value in this Area
Purchase History
| Date | Buyer | Sale Price | Title Company |
|---|---|---|---|
| Miles Damon C | -- | Chicago Title | |
| Miles Damon C | -- | Stewart Title | |
| Huke Robert L | -- | Chicago Title Insurance Co |
Source: Public Records
Mortgage History
| Date | Status | Borrower | Loan Amount |
|---|---|---|---|
| Closed | Miles Damon C | $71,957 | |
| Closed | Miles Damon C | $73,512 | |
| Previous Owner | Huke Robert L | $58,700 |
Source: Public Records
Tax History
| Year | Tax Paid | Tax Assessment Tax Assessment Total Assessment is a certain percentage of the fair market value that is determined by local assessors to be the total taxable value of land and additions on the property. | Land | Improvement |
|---|---|---|---|---|
| 2025 | $1,923 | $24,624 | $4,387 | $20,237 |
| 2024 | $1,914 | $24,217 | $2,523 | $21,694 |
| 2023 | $1,914 | $24,218 | $2,495 | $21,723 |
| 2022 | $1,549 | $18,620 | $3,249 | $15,371 |
| 2021 | $1,549 | $18,620 | $3,249 | $15,371 |
| 2020 | $1,491 | $17,689 | $3,249 | $14,440 |
| 2019 | $1,477 | $17,689 | $3,249 | $14,440 |
| 2018 | $1,413 | $16,818 | $3,115 | $13,703 |
| 2016 | $1,262 | $16,397 | $2,033 | $14,364 |
Source: Public Records
Map
Nearby Homes
- 658 N Mohican Dr
- 18924 E 6th St N
- 301 & 401 N Jones Rd
- 18900 E 6th St N
- 817 N Mohican Dr
- 18607 E 6th St N
- 18602 E 6th St N
- 818 N Wigwam Trail
- 834 N Ponca Dr
- 18805 E Arrowhead Dr
- 18904 E Arrowhead Dr
- 18919 E Arrowhead Dr
- 19610 E Bundschu Rd
- 18303 E 7th St N
- 18505 E Bundschu Place
- 827 N Choctaw Ave
- 901 N Choctaw Ave
- 18404 E Blackhawk Trail
- 1305 N Holland Dr
- 1313 N Holland Dr
- 19301 E 5th Terrace Ct N
- 19309 E 5th Terrace Ct N
- 19304 E 5th Street Ct N
- 19225 E 5th Terrace Ct N
- 19300 E 5th Street Ct N
- 19300 E 5th Terrace Ct N
- 19300 E 5th Ct
- 19308 E 5th Street Ct N
- 19224 E 5th Street Ct N
- 19304 E 5th Terrace Ct N
- 19221 E 5th Terrace Ct N
- 19300 E 5th Terrace Ct N
- 19308 E 5th Terrace Ct N
- 19401 E 5th Terrace Ct N
- 19220 E 5th Street Ct N
- 19224 E 5th Terrace Ct N
- 19400 E 5th Street Ct N
- 19220 E 5th Terr Ct N
- 19217 E 5th Terrace Ct N
- 19400 E 5th Terrace Ct N